Introducing Radar:
Modern Kubernetes Visibility
By Nadav Erell, CEO
We got frustrated. So we built something and decided to give it away.
The Problem
kubectl is always there. It works. But when you're debugging - jumping between describe, logs, get events, mentally mapping how resources connect - it's tedious.
The GUI tools that should make this easier all have their issues and limitations.
Lens got acquired and lost its way. Mirantis bought Lens in 2020, promising to keep it free and open source. Then came mandatory logins, subscription tiers, and in January 2024, they closed the source entirely. Meanwhile, performance degraded - users on the forums describe it as "very clunky and slow" even on machines with 32 cores and 128GB RAM. One noted that "every time I update to a new release I wait to see if it gets worse - and usually it does."
The open-source forks inherited the problems. Freelens and OpenLens are community efforts to keep the old Lens alive, but they're forks of the same codebase. OpenLens stopped being maintained. Freelens is active, but the architectural baggage remains.
The official Kubernetes Dashboard is archived. Headlamp is the recommended replacement. It recently added a Map View for topology, but it's still primarily a resource browser. No event timeline, no Helm management, no traffic visualization. Getting authentication working requires setting up service accounts or OIDC - overkill for local debugging. And extending it for your CRDs requires writing JavaScript plugins.
k9s is great, but it's a terminal. If you live in the terminal, k9s is fantastic - fast, keyboard-driven, no nonsense. But the learning curve is real (memorizing :po, :deploy, :svc shortcuts takes time), and there's no topology or visual overview. For some workflows - especially onboarding new team members or debugging unfamiliar clusters - a graphical interface is just faster.
Enterprise platforms exist. Komodor, Cast AI, and others offer some of what we wanted - behind steep per-node pricing that makes no sense for small teams, and with mandatory cloud data sync that regulated industries can't accept.
Weave Scope is dead. If you wanted topology visualization specifically, Weave Scope was the answer - until Weaveworks shut down in 2024. Nothing replaced it.
You're stuck choosing between slow and bloated, lightweight but limited, or expensive and cloud-dependent.
Time spent fighting your tools is time not spent fixing the problem.
What We Built
We'd been using an internal tool at Skyhook for cluster debugging and demos. It started as a quick project to scratch our own itch - we wanted something fast, something that didn't require a cloud account, something that actually showed how resources relate to each other.
Eventually we realized the problem we solved for ourselves is the same problem everyone else has. So we open-sourced it.
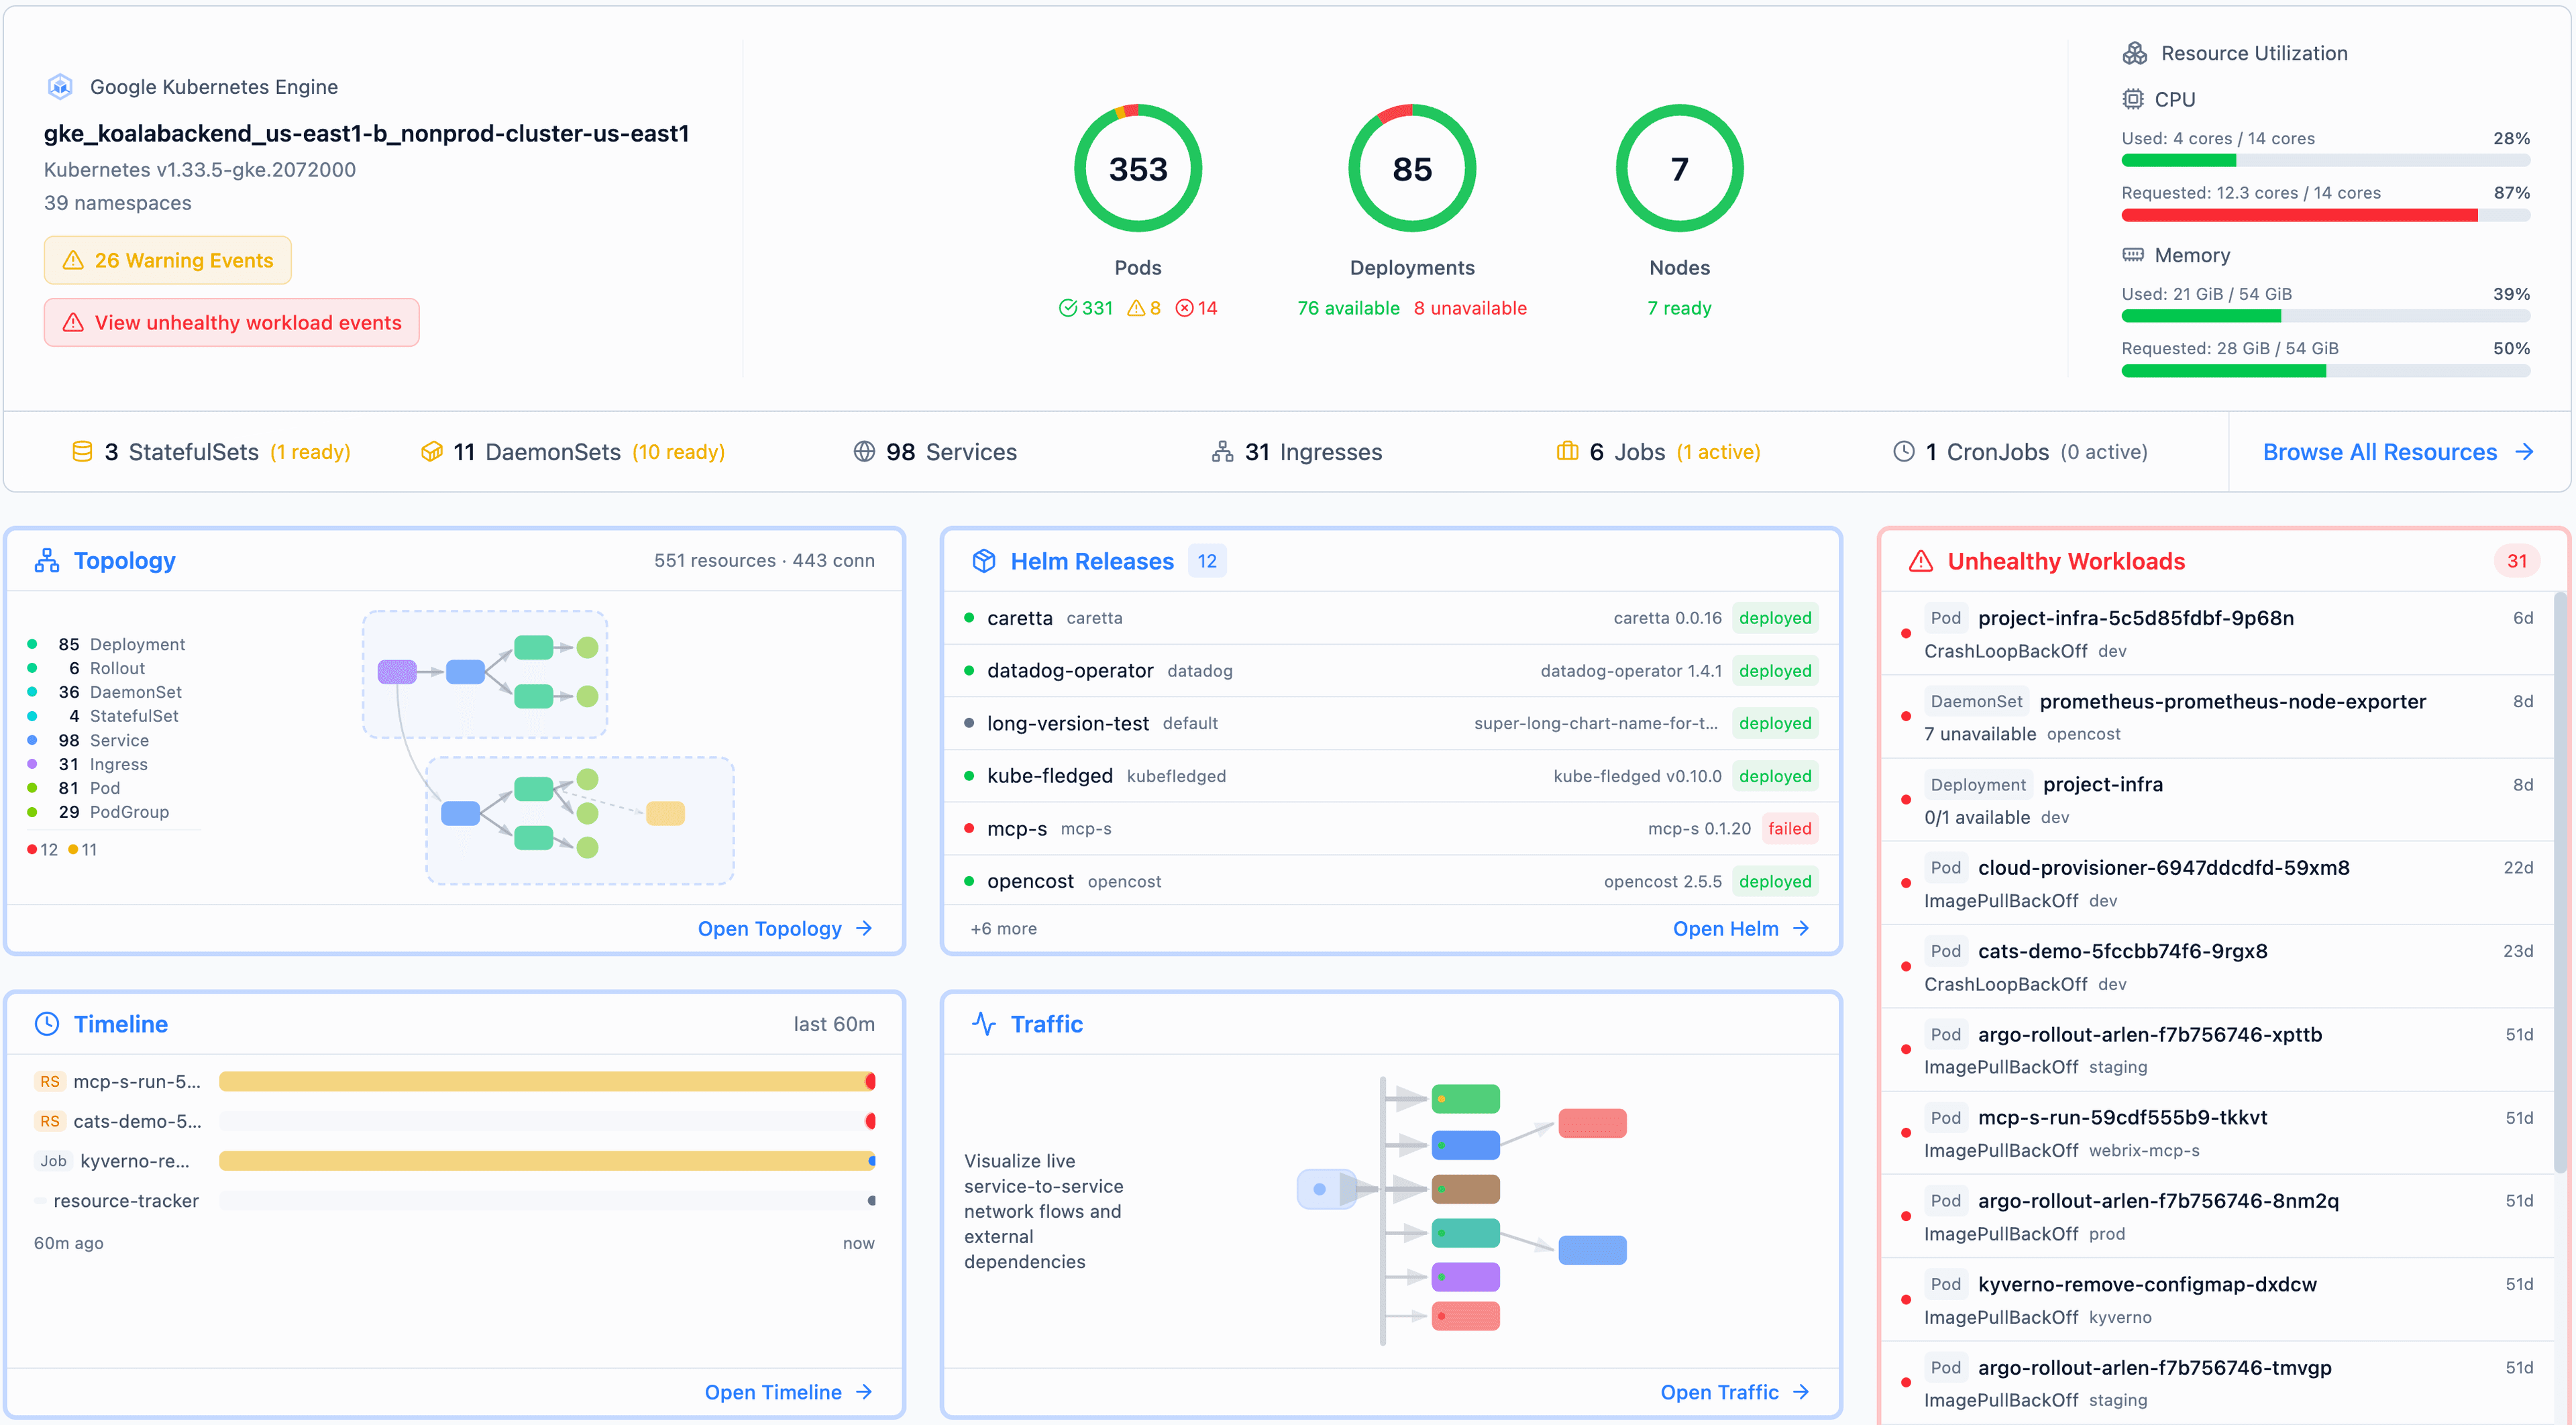
Radar is a single Go binary with the React frontend embedded inside. No Electron. It starts instantly, uses minimal memory, and runs entirely on your machine. Connect to your cluster via your existing kubeconfig, and a real-time dashboard opens in your browser.
No cluster-side installation required. Nothing to deploy in-cluster. No CRDs. No cloud login. No data leaving your machine.
curl -fsSL https://get.radarhq.io | sh
kubectl radar
Also available via Homebrew, Krew, or Helm for in-cluster deployment. See the full install guide on radarhq.io.
That's it. The dashboard opens in your browser, connected to whatever cluster context is active.
What It Does
Resources View
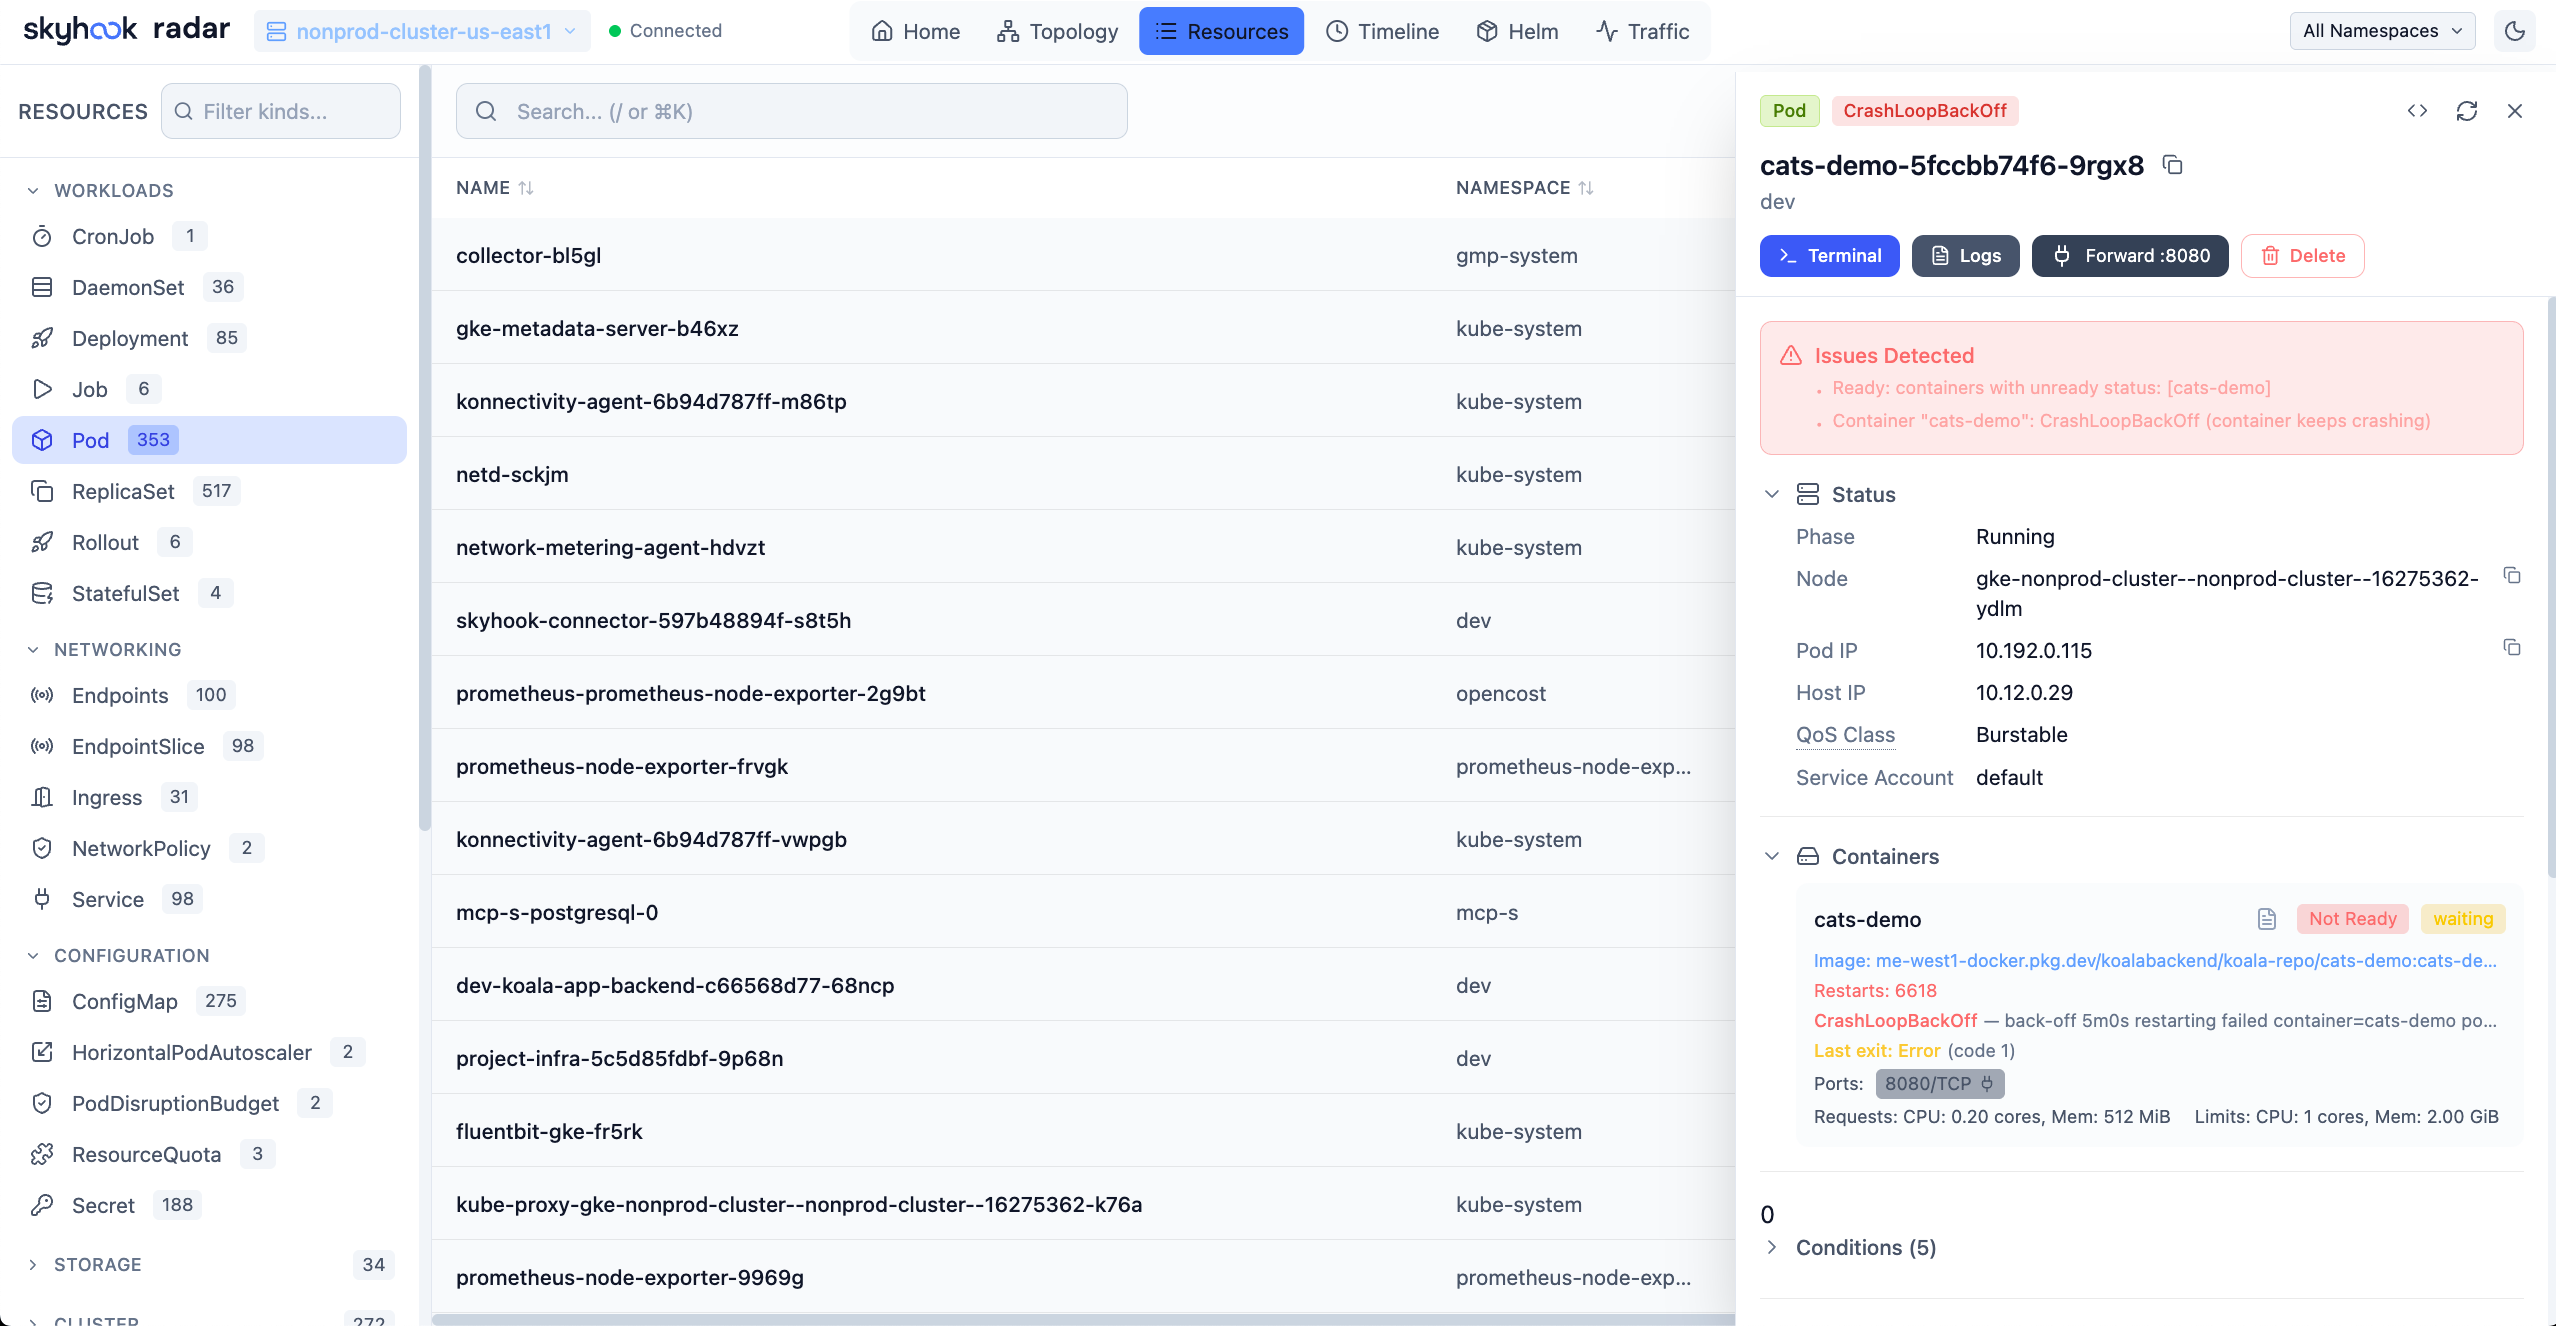
First, the table stakes. Everything you expect from a Kubernetes dashboard, plus a few things you don't:
- Browse all resource types, search by name, filter by status or problems
- Click any resource for YAML (view and edit), logs, events, exec, port-forwarding
- Browse container image filesystems directly - no pulling images or exec'ing in
- Smart columns per resource kind, status highlights, related resources at a glance
Argo CD and Flux resources show up with sync status out of the box - no plugins to install. It's a bit surprising that tools like Headlamp still treat GitOps as an afterthought when most production clusters run one of these two systems.
That's the baseline. Here's what else you get:
Topology View
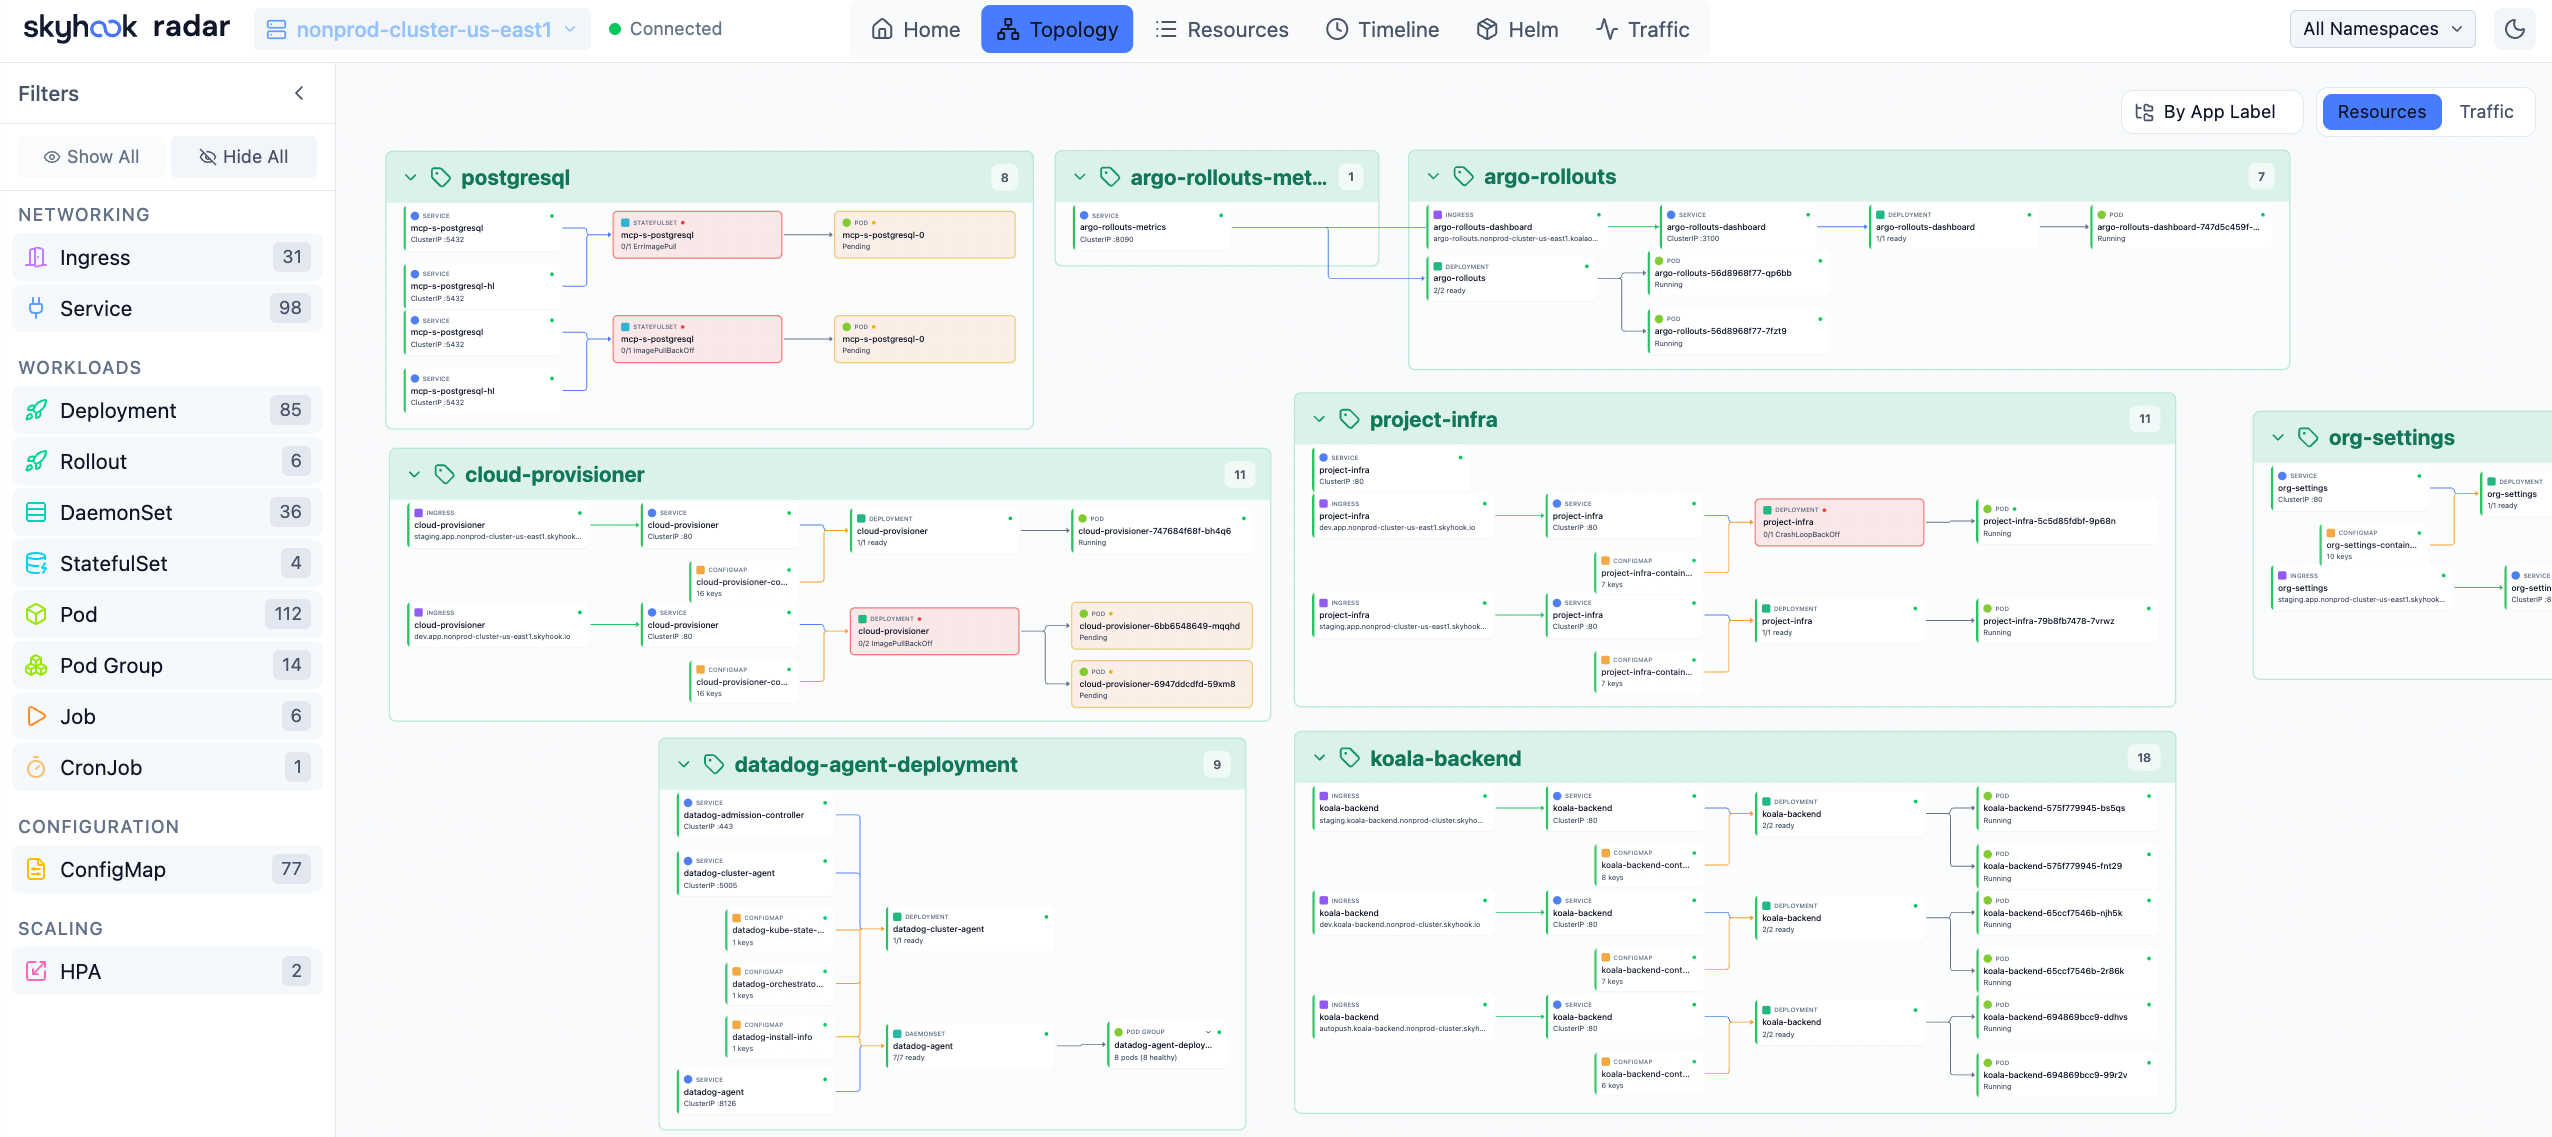
An interactive graph showing how your Kubernetes resources connect in real-time.
The key design decision: structured DAG layout instead of force-directed physics. Most open-source visualizers (KubeView, the old Weave Scope) use force-directed layouts where nodes bounce around based on simulated physics. This looks cool in a demo with 10 pods. It becomes an unreadable hairball in a real cluster.
Radar shows the actual relationships between resources:
- Ownership chains (Deployment → ReplicaSet → Pods)
- Service routing (which pods a Service selects)
- Ingress paths (Ingress → Service → backend)
- Configuration dependencies (which ConfigMaps and Secrets a workload uses)
- HPA scaling targets
Resources with problems light up in yellow or red, so you can spot issues at a glance without clicking through lists. Group by namespace, by app label, or view ungrouped. Filter by resource kind. Click any node for full details.
Timeline View
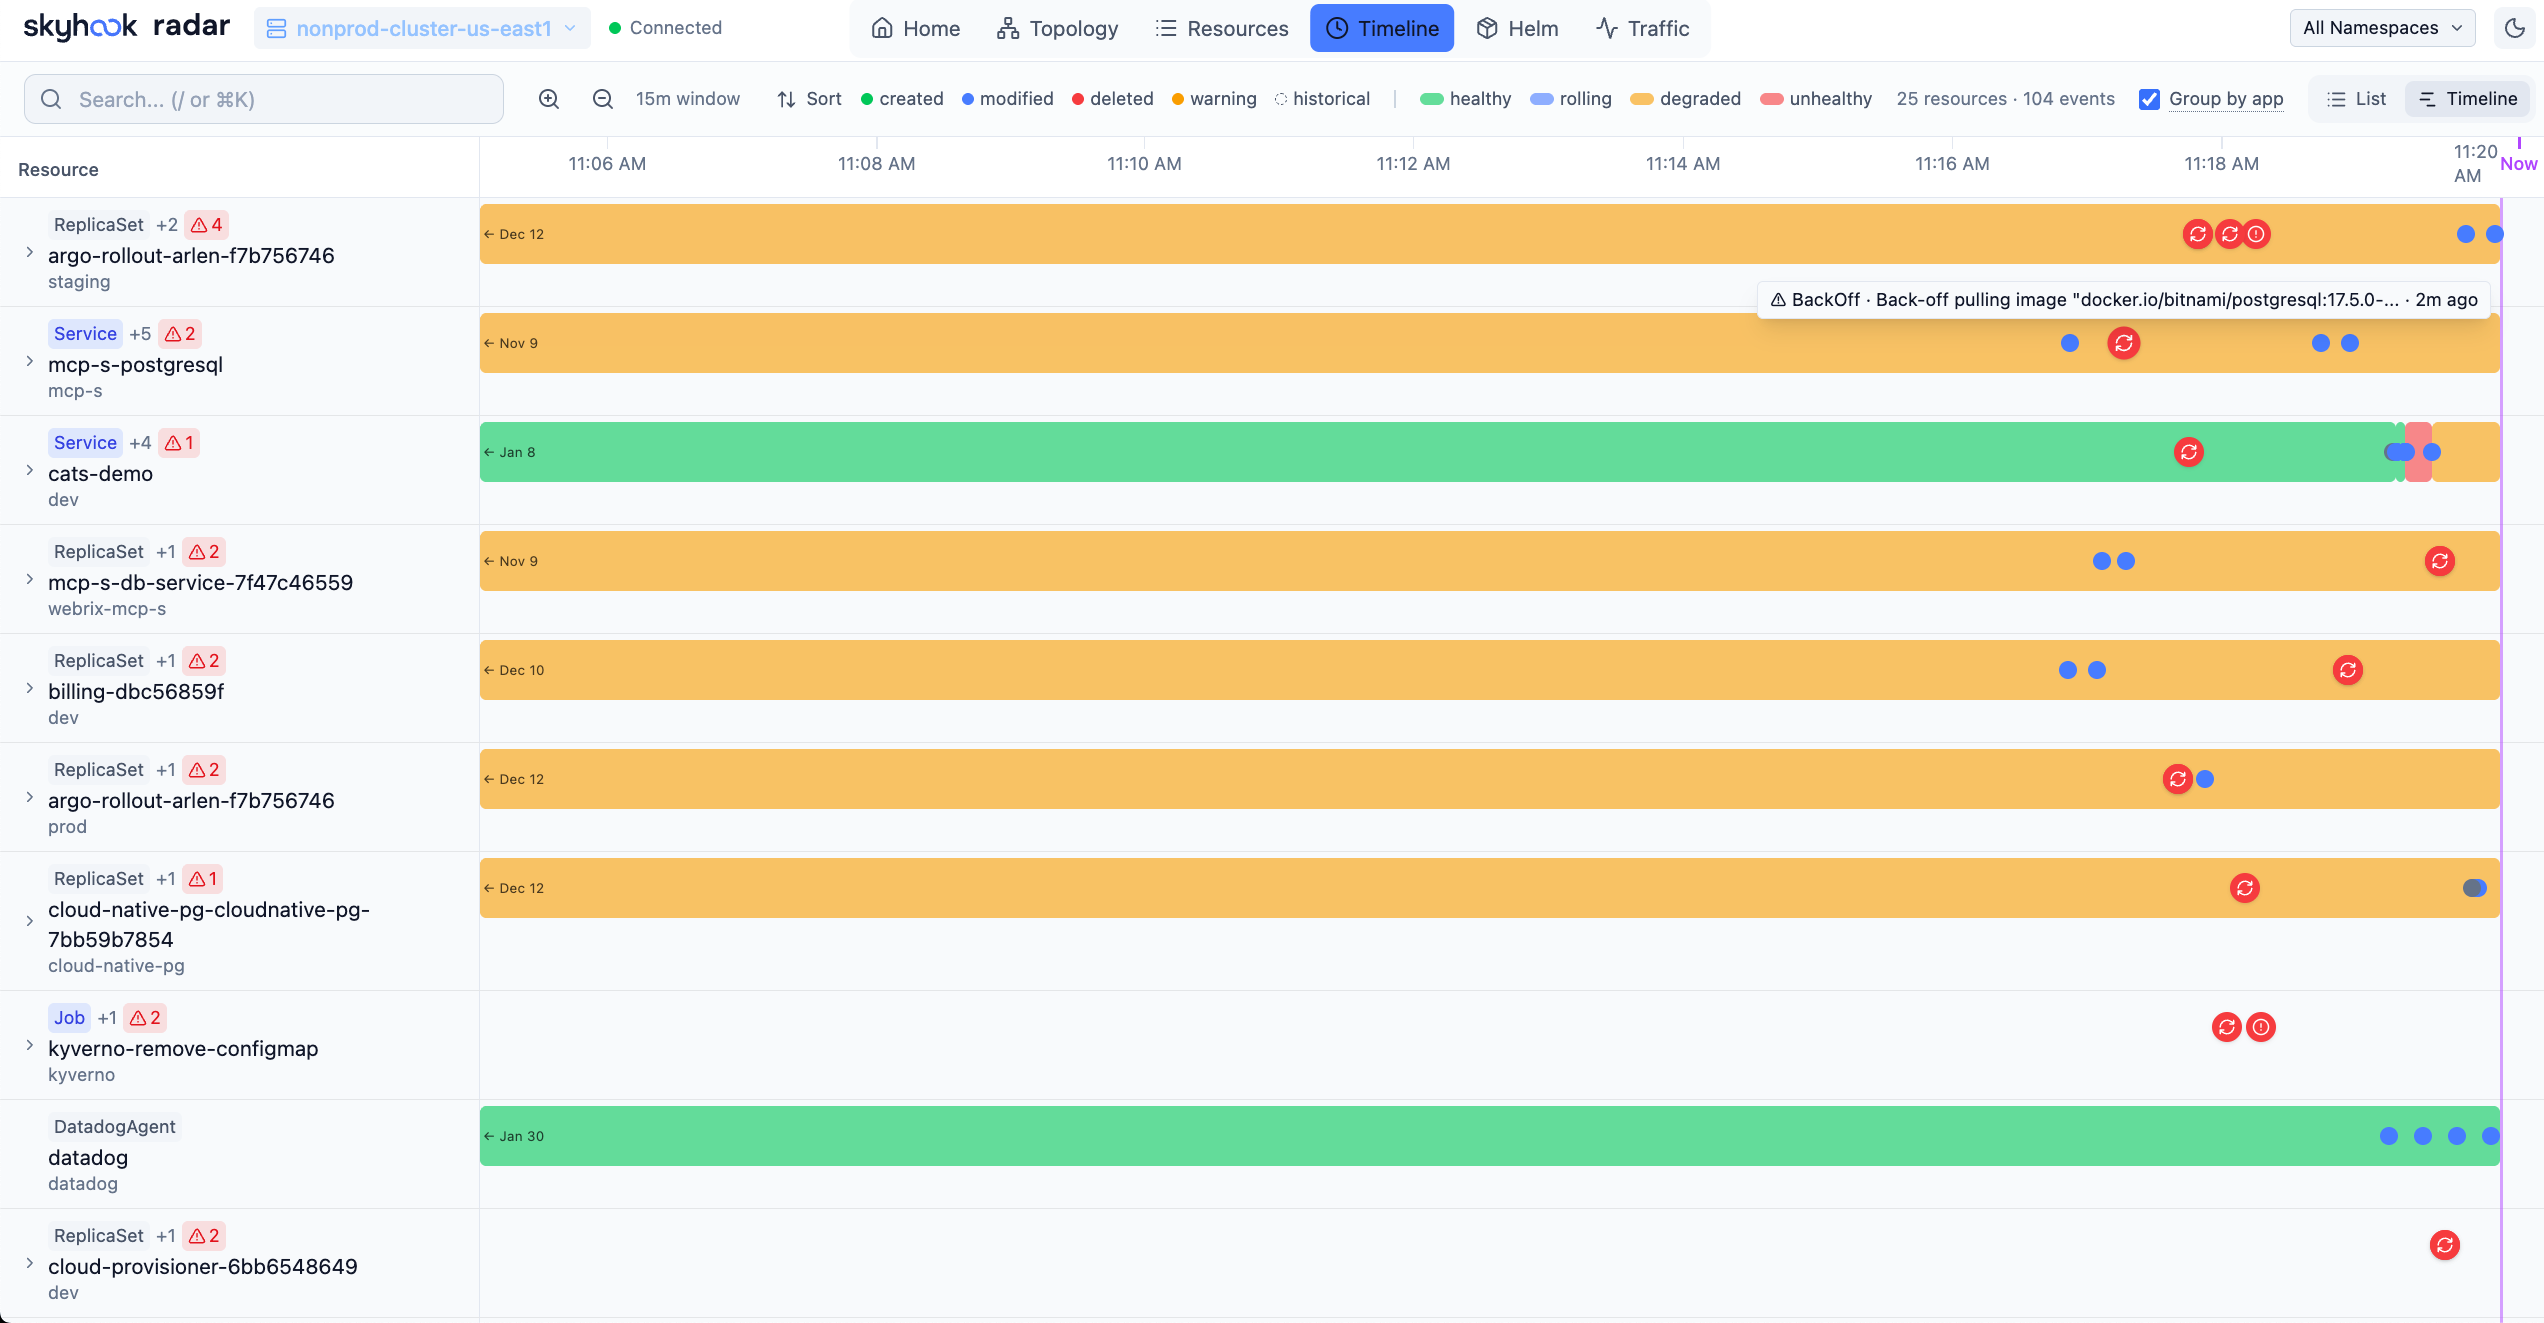
A unified stream of Kubernetes events and resource changes as they happen. Filter by event type (all events or warnings only). See what changed in the last 5 minutes. Resources with recent warnings get a visual badge on the topology.
This captures most of the "what just happened?" value without requiring a separate storage backend. Events come straight from the Kubernetes API in real-time.
Helm View
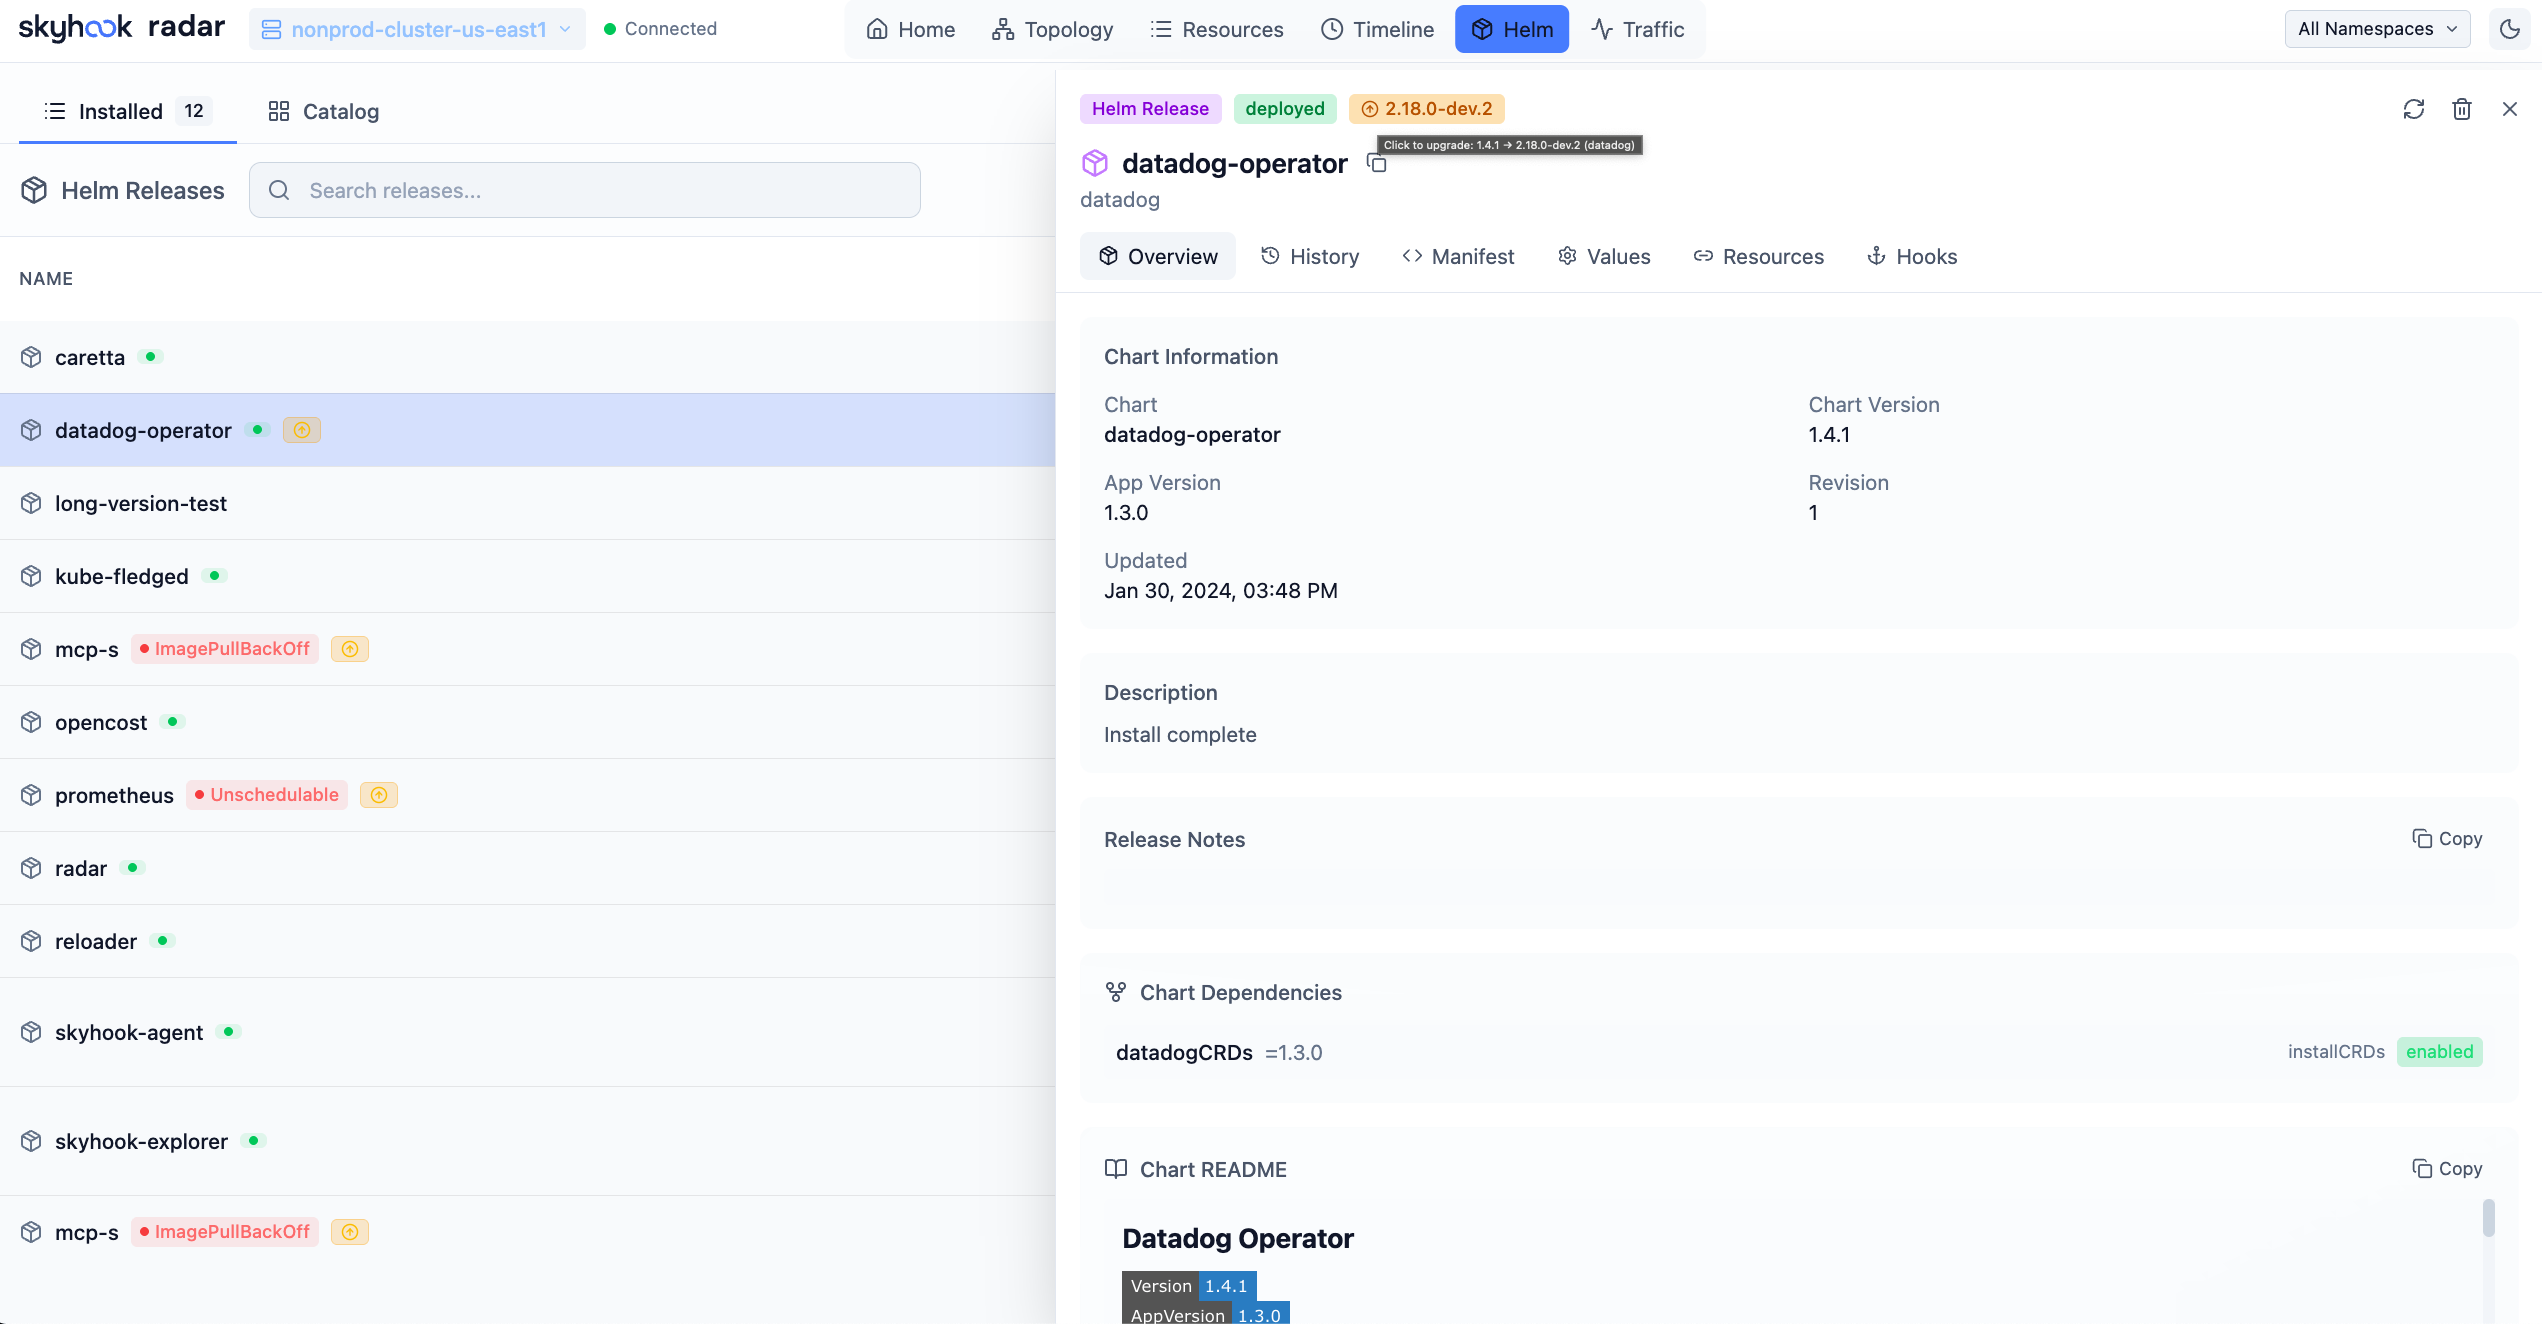
See all Helm releases across namespaces with status, chart version, and app version. Each release shows the health of its owned resources, so you know at a glance if something's wrong. Inspect values, compare revisions, view release history. Install, upgrade, rollback, or uninstall directly from the UI.
Traffic View
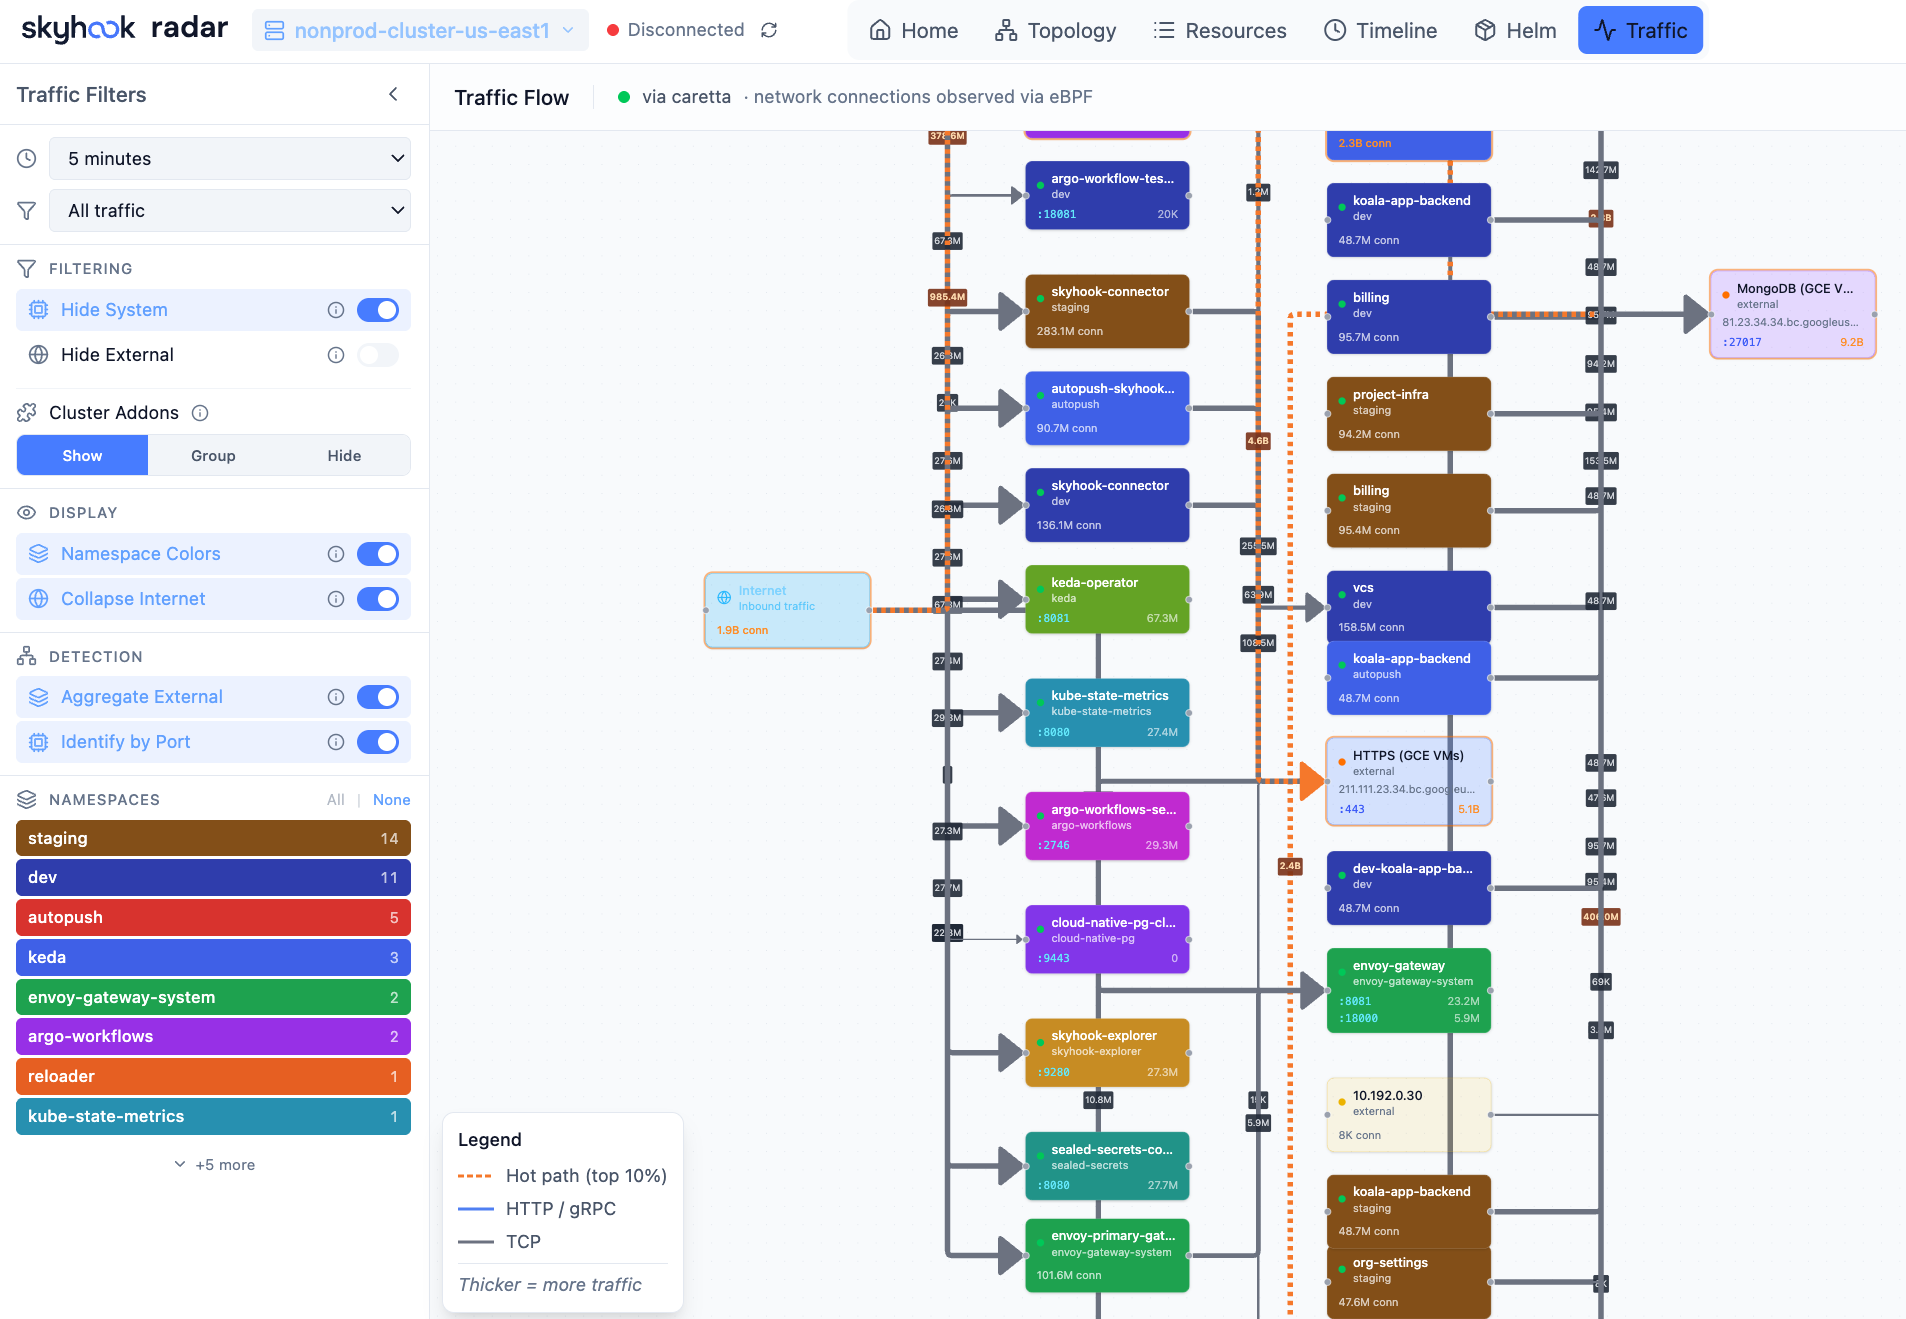
If you have Cilium with Hubble or Caretta installed, Radar auto-detects them and shows live network traffic between services. Animated flow graph showing requests per second. If no traffic source is detected, there's a setup wizard to install one.
Technical Details
Radar is a single Go binary with the React frontend embedded at compile time using go:embed. No separate static file server, no runtime dependencies. The binary talks directly to your Kubernetes API server using your kubeconfig credentials.
How the real-time updates work
The backend uses client-go SharedInformers - the same pattern the Kubernetes controller runtime uses internally. On startup, Radar does a single list operation per resource type, then switches to the Watch API. The API server pushes deltas (add/update/delete) over a persistent connection. No polling.
When a resource changes, the informer callback fires, updates the in-memory cache, and broadcasts the change to connected browsers via Server-Sent Events (SSE). A pod crashes, the UI reflects it in milliseconds - not on your next manual refresh.
For CRDs and dynamic resources, we use dynamic informers that auto-discover API groups at startup. If your cluster has Argo Rollouts, Istio VirtualServices, or custom CRDs, Radar picks them up automatically.
GitOps tools get first-class treatment: Argo CD Applications and Flux resources (Kustomizations, HelmReleases, GitRepositories) show up in the topology with sync status, and you can trigger common operations like sync and reconcile directly from the UI.
What this means in practice
- Minimal API server load. Watch streams are cheap. We're not hammering your cluster with list calls every 5 seconds.
- Instant updates. The latency is network RTT, not poll interval.
- Memory-efficient. We strip
managedFieldsand other heavy metadata from cached objects. The cache holds what you need to see, not what kubectl stores internally.
Other implementation details
- Helm SDK integration. Helm operations (list, upgrade, rollback, uninstall) use the Helm Go SDK directly - not shelling out to the
helmCLI. - WebSocket for exec. Pod terminal sessions use a WebSocket connection, same protocol as
kubectl exec. - Port forwarding. Managed sessions with automatic cleanup, exposed via the UI.
- chi router. Lightweight HTTP routing, no framework bloat.
Works with any conformant Kubernetes cluster: GKE, EKS, AKS, minikube, kind, k3s. Respects your existing kubeconfig contexts and RBAC permissions. If you can kubectl get pods, Radar can show them to you.
For teams that want shared access, there's a Helm chart to deploy Radar inside the cluster. Teams looking for managed multi-cluster, SSO, and retention can see Radar Cloud pricing:
helm repo add skyhook https://skyhook-io.github.io/helm-charts
helm install radar skyhook/radar -n radar --create-namespace
What It Doesn't Do
Radar covers a lot of ground, but it's not trying to be everything.
- No built-in persistence. Timeline events are in-memory by default. You can enable SQLite storage with
--timeline-storage sqlitefor persistence across restarts, but there's no multi-week retention or time-travel queries. - Single cluster at a time. The OSS version connects to one cluster context. You can switch contexts, but there's no aggregated multi-cluster view. For a multi-cluster aggregated view, see Radar Cloud.
Why Open Source
A few reasons:
The incumbents lost the plot. Lens started as a genuinely useful tool. Then it got acquired, commercialized, bloated with features, and now requires cloud authentication. The pattern repeats across the industry - tools get popular, get acquired, get worse. We wanted something that stays simple.
Local-first matters. We've watched tool after tool add mandatory cloud logins, telemetry requirements, or "call home" features. For teams in regulated industries - finance, healthcare, defense - sending cluster metadata to a third-party cloud is a non-starter. Radar runs entirely on your machine. No accounts, no telemetry, no data exfiltration.
Speed is a feature. When you're debugging a production incident at 2am, you don't want to wait 30 seconds for your cluster to connect. You don't want to watch loading spinners every time you click something. You want to see what's happening now.
We use it ourselves. Radar started as an internal tool. Open-sourcing it means more eyes on the code, more bug reports, and more feature ideas. The best way to maintain software is to have other people depending on it.
Get Started
# Quick install
curl -fsSL https://get.radarhq.io | sh

# Homebrew
brew install skyhook-io/tap/radar

# Krew
kubectl krew install radar

# In-cluster (Helm)
helm repo add skyhook https://skyhook-io.github.io/helm-charts
helm install radar skyhook/radar -n radar --create-namespace
Then just run:
kubectl radar
# or just
radar
The source is on GitHub: github.com/skyhook-io/radar. Apache 2.0 license. Contributions welcome.
If you find bugs or have feature ideas, open an issue. We're building this because we need it - and we suspect you do too.
Looking for a managed, multi-cluster version? Radar Cloud builds on the OSS core.