The Kubernetes Production Readiness Checklist Every Service Needs
By Roy Libman, CPO
Services don't usually fail in production the way you'd expect.
It's not the clever feature you spent two weeks designing. It's not the algorithm you stress-tested. It's the readiness probe that pings the database, so when Postgres has a 10-second blip the entire service goes NotReady and Kubernetes stops routing traffic. It's the deployment that only has one replica because the dev environment never needed two. It's the image tagged :latest, which pulled a different SHA today than it did yesterday, and now nobody can reproduce the bug.
The boring stuff is what breaks. So the boring stuff is what you check. It's not a fringe problem either: in Red Hat's 2024 State of Kubernetes Security report, misconfigurations were the single biggest cause of security incidents, at 59% - ahead of vulnerabilities and failed audits. Not zero-days, not sophisticated attacks. Just things a checklist would have caught.
This post is the production-readiness checklist we run against every Kubernetes service before we'll call it production-ready - the same checklist that ships built into Skyhook's Production Readiness Framework, evaluated automatically on every deployment, grouped into five categories. For each check, I'll cover what it catches, why it's on the list, and how to fix it when it fails.
TL;DR. Production readiness is around 20 boring checks across five categories: reliability, security, resilience, performance, and resource hygiene. Most teams know they should be doing all of them. Almost none do all of them consistently, because tribal knowledge degrades fast. The fix is to automate the checklist, surface results next to every service, and let teams either fix or acknowledge with a documented reason. The enforcement layer is optional but valuable for org-wide standards.
Why automate the checklist
You can absolutely run this checklist by hand. Teams do, and the good ones internalize most of it. The cost is that "good production-readiness practices" lives in people's heads. When somebody leaves, some of it leaves with them. When a new service launches at 4pm on a Friday because a customer demoed it, half the checklist gets skipped. And the drift only compounds as the team grows and the original context fades.
The other reason to automate: this list has 20-ish items, and you'll be evaluating it for every service, every deployment, forever. That's not a code-review checklist; it's a CI check. Either it runs automatically and tells you when something regressed, or it doesn't really exist.
Most teams climb the same ladder, and most stall on the bottom rung:
- Documentation - a wiki page engineers are supposed to check by hand. Compliance declines the moment a deadline hits.
- CI checks -
kube-linter,kubeconform, orcheckovfail the PR on a bad manifest. Catches YAML mistakes, but can't see runtime state or drift. - Admission control - Kyverno or OPA Gatekeeper reject non-compliant resources at the door. Nothing lands without passing.
- Continuous scanning - the same policies run on a schedule, catching drift and resources that were deployed before the policy existed.
The teams that ship reliably operate on the top two rungs. The rest of this post is the checklist itself, then how to get there.
Skyhook's Production Readiness Framework scans every service deployment against the checklist, marks each check pass / warn / fail, suggests an actionable fix for each failure, and lets you either fix or acknowledge with a documented reason. Optionally, it pairs with Kyverno to block non-compliant deployments at admission control. The rest of this post is what the framework actually checks, and why.
Category 1: Reliability
Reliability checks catch the failures that make your service unavailable to its users even when the cluster is otherwise fine.
Readiness probe configured. Without a readiness probe, Kubernetes routes traffic to your pod the moment the container starts - including the first few seconds when your process is still loading config, opening database connections, or warming caches. New deployments serve errors during rollout. Fix: add a readinessProbe that checks the dependencies your service can't live without.
Liveness probe configured. Without a liveness probe, a deadlocked or hung process stays in the pool until something else notices. With one, Kubernetes restarts a stuck pod automatically. Fix: add a livenessProbe - but keep it bare. This is the most common place teams shoot themselves in the foot. If your liveness probe checks Postgres, every Postgres incident becomes a full pod restart, which is itself load on Postgres. Liveness should answer "is this process alive?" and nothing else.
Valid probe timeouts. The default timeoutSeconds: 1 is short enough that any garbage-collection pause looks like a probe failure. The check fails when timeouts are too aggressive for the workload (and on the other side, it warns when they're so generous they make the probe useless). Fix: tune timeoutSeconds, periodSeconds, and failureThreshold to the actual latency profile of your /health endpoint.
All three probes, with the right division of labor - and three distinct endpoints, not one shared /health:
containers:
  - name: api
    image: ghcr.io/org/api:v2.41.7
    startupProbe:                # Give slow starters up to 60s before liveness kicks in
      httpGet:
        path: /healthz
        port: 8080
      periodSeconds: 2
      failureThreshold: 30
    readinessProbe:              # Gates traffic - check the deps you can't serve without
      httpGet:
        path: /readyz
        port: 8080
      periodSeconds: 5
      failureThreshold: 3
    livenessProbe:               # Keep bare - "is the process alive?" and nothing else
      httpGet:
        path: /livez
        port: 8080
      periodSeconds: 10
      failureThreshold: 3
Rolling update strategy. The Recreate strategy terminates all old pods before starting new ones - guaranteed downtime on every deploy. RollingUpdate is the default, but it's easy to override and forget. The check fails when a Deployment uses Recreate instead of RollingUpdate, or when maxUnavailable is set so high it can take the service below capacity mid-rollout. Fix: set strategy.type: RollingUpdate with maxUnavailable: 0 (or a small fraction) and maxSurge: 25%.
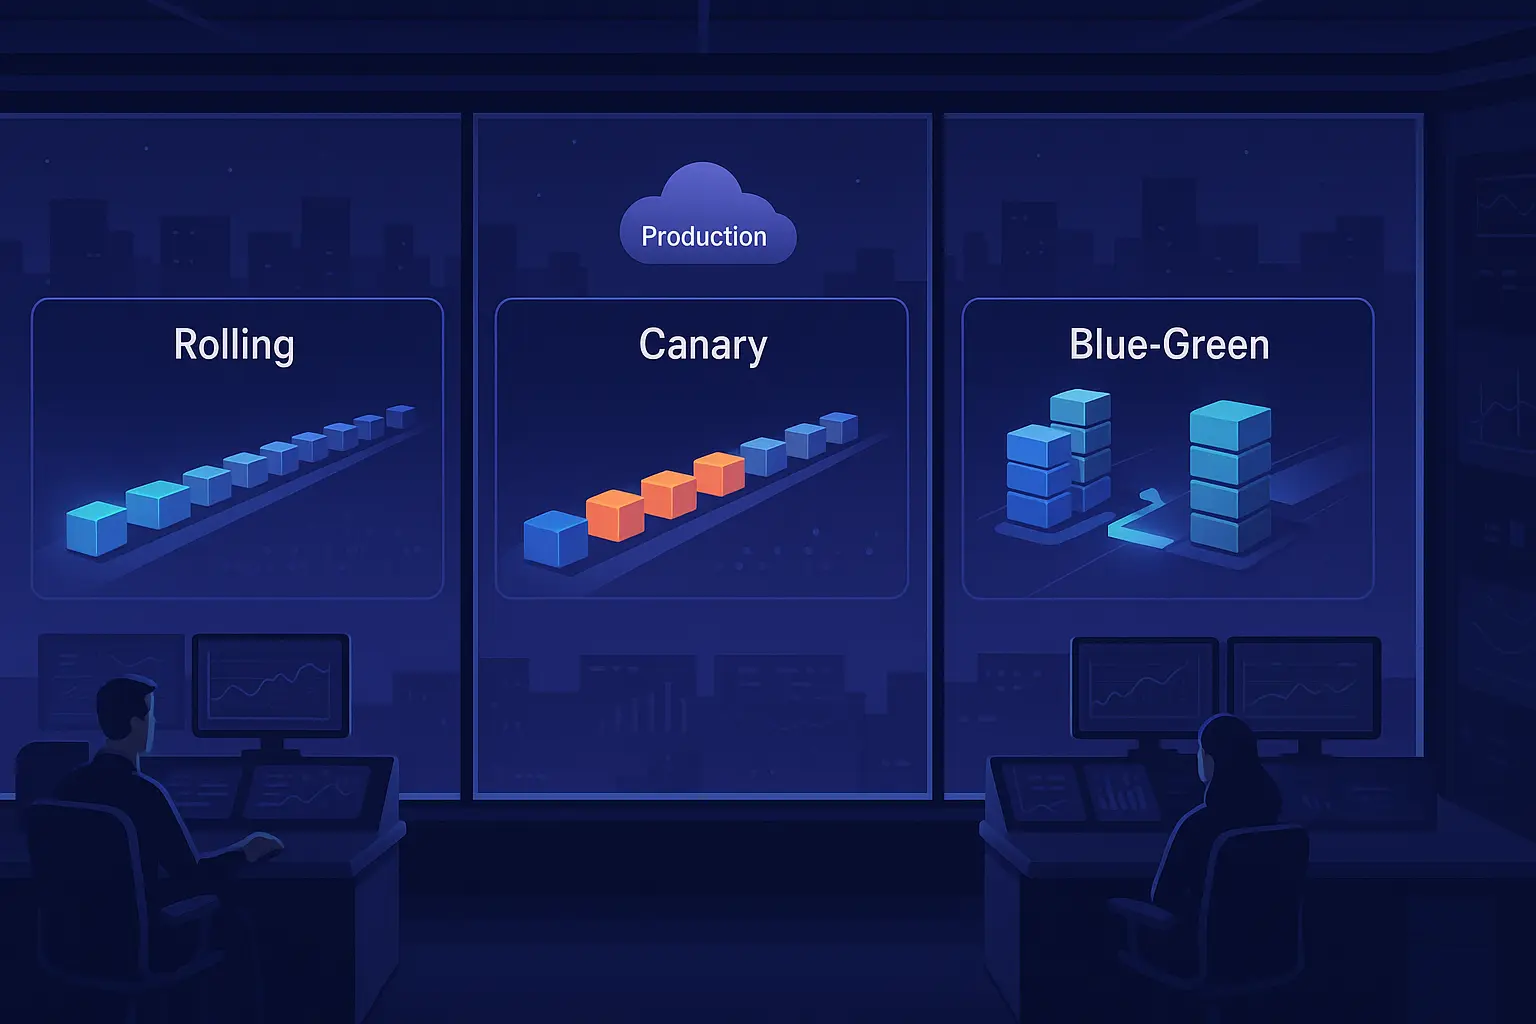
Multiple replicas (≥2). A single-replica Deployment goes to zero capacity every time a node drains, every time a pod restarts, every time Kubernetes evicts for any reason. This is the single most common cause of "our prod just went down for 30 seconds" tickets. Fix: set replicas: 2 minimum for any service that handles user traffic. If you're using HPA, set minReplicas: 2. (For deployment patterns that pair with this - canary, blue-green, rolling - see Ship Without Fire Drills.)
The replica and rollout settings together:
spec:
  replicas: 3                  # >=2 for any user-facing service, 3 tolerates one failure
  strategy:
    type: RollingUpdate
    rollingUpdate:
      maxSurge: 25%            # Allow 25% extra pods during rollout
      maxUnavailable: 0        # Never drop below desired count
  minReadySeconds: 10          # Settle before marking a new pod available
Category 2: Security
Security checks catch the misconfigurations that turn a routine vulnerability into a serious incident. (For the image and supply-chain side of this, see our compromise audit checklist.)
Non-root user. Containers that run as UID 0 inherit root inside the container, which makes container escapes much more dangerous. The check fails when securityContext.runAsNonRoot is missing or false. Fix: set runAsNonRoot: true and runAsUser: <some non-zero UID> in the pod or container securityContext. If your image was built to run as root, rebuild it with a USER directive in the Dockerfile.
No privileged containers. A privileged container has effectively the same access as a process on the host. The check fails when securityContext.privileged: true is set anywhere in the pod spec. There are legitimate reasons to need this (some CNI plugins, some node-level agents) but they're rare and should be exceptions you acknowledge, not defaults. Fix: remove the privileged: true flag and use specific Linux capabilities via securityContext.capabilities.add instead.
Read-only root filesystem. A writable root filesystem means an attacker who pops the process can drop arbitrary binaries and modify the container image at runtime. The check fails when securityContext.readOnlyRootFilesystem is unset or false. Fix: set readOnlyRootFilesystem: true and mount emptyDir volumes for the specific paths your service needs to write to (temp directories, cache locations).
Privilege escalation disabled. Without allowPrivilegeEscalation: false, a process can gain privileges via setuid binaries or capabilities. Fix: set allowPrivilegeEscalation: false in the container securityContext.
The four container hardening checks above are one securityContext block. This matters more than it looks: running workloads as root is still common, and a single container escape on a root container lands the attacker on the node as root.
containers:
  - name: api
    securityContext:
      runAsNonRoot: true
      runAsUser: 1000
      readOnlyRootFilesystem: true
      allowPrivilegeEscalation: false
      capabilities:
        drop: ["ALL"]          # Add back only what you need (e.g. NET_BIND_SERVICE)
Default-deny Network Policy. Without a NetworkPolicy, any pod can talk to any other pod in the cluster - so a single compromised container has full lateral movement. The check warns when a namespace has no default-deny policy. Fix: start every namespace with a default-deny, then allowlist the specific flows each service needs.
apiVersion: networking.k8s.io/v1
kind: NetworkPolicy
metadata:
  name: default-deny-all
  namespace: production
spec:
  podSelector: {}              # Applies to every pod in the namespace
  policyTypes: [Ingress, Egress]
TLS on Ingress. An Ingress serving plain HTTP in production leaks credentials, session tokens, and PII into any network it traverses. The check fails when an Ingress has no tls block or its hosts don't all have certificates. Fix: configure TLS via cert-manager or your platform's equivalent. There is no good reason a production Ingress should still be plain HTTP in 2026.
Image tag is not :latest. Tags like :latest (or :stable, or an unpinned major version) mean two pods of the same Deployment can be running different code, and rollbacks can become impossible. The check warns when an image tag is mutable or missing. Fix: pin to a specific tag (v2.41.7), or better, to the image digest (@sha256:...). Whichever you choose, treat tag mutability as an antipattern.
Category 3: Resilience
Resilience checks catch the failures that turn routine cluster operations into customer-facing incidents.
Pod Disruption Budget defined. Without a PDB, a node drain (for an OS upgrade, an autoscaler scale-down, a node replacement) can evict every pod of your Deployment simultaneously. Fix: define a PodDisruptionBudget with minAvailable: 1 (or maxUnavailable: 50% for larger Deployments). This is the single check that most directly catches "we did a routine cluster maintenance and accidentally took prod down."
apiVersion: policy/v1
kind: PodDisruptionBudget
metadata:
  name: api-pdb
spec:
  minAvailable: 2              # Keep at least 2 pods up during voluntary disruptions
  selector:
    matchLabels:
      app: api
Multi-zone distribution. A Deployment whose pods all land on nodes in the same availability zone goes dark when that zone has an issue. The check fails when nothing spreads the pods across topology.kubernetes.io/zone. Fix: add a topologySpreadConstraints block with topologyKey: topology.kubernetes.io/zone and whenUnsatisfiable: ScheduleAnyway (or DoNotSchedule if you want hard distribution).
spec:
  template:
    spec:
      topologySpreadConstraints:
        - maxSkew: 1
          topologyKey: topology.kubernetes.io/zone
          whenUnsatisfiable: ScheduleAnyway   # DoNotSchedule to spread hard
          labelSelector:
            matchLabels:
              app: api
Graceful shutdown. When Kubernetes sends SIGTERM, it starts removing the pod from Service endpoints concurrently - and that removal can lag behind the signal, so in-flight requests still hit a pod that has begun shutting down. The check warns when a pod has no preStop hook or a too-short terminationGracePeriodSeconds. Fix: add a short preStop sleep so endpoint removal propagates before your app stops accepting connections, and make sure the app handles SIGTERM (drain, finish in-flight work, exit) inside the grace period.
spec:
  terminationGracePeriodSeconds: 45   # Hard deadline before SIGKILL
  containers:
    - name: api
      lifecycle:
        preStop:
          exec:
            command: ["/bin/sh", "-c", "sleep 5"]   # Let endpoint removal propagate
Replica count appropriate for tier. A "tier-1" production service running with 2 replicas might satisfy the previous reliability check but still be under-provisioned for its actual traffic. A flat "minimum 2" floor treats payments-api and internal-tooling-dashboard the same, which they aren't. The fix is a tiered floor: tag services by criticality and require a higher replica minimum for higher tiers. (This is one place a platform helps - Skyhook lets you set per-tier floors so the same check enforces a stricter standard where it matters.)
Category 4: Performance
Performance checks catch the misconfigurations that don't fail tests but quietly degrade your latency or your cluster's economics.
Horizontal Pod Autoscaler configured. Without an HPA, traffic spikes either get absorbed by over-provisioned capacity (expensive) or cause cascading slowdowns (bad). The check warns when a Deployment has no HPA targeting it, and fails when the HPA's maxReplicas is set to a value that can't actually serve peak load. Fix: configure an HPA on CPU or a custom metric, with minReplicas matching your "always-on" floor and maxReplicas sized for peak. Set a scale-down stabilization window too, or a brief traffic dip churns your pods.
apiVersion: autoscaling/v2
kind: HorizontalPodAutoscaler
metadata:
  name: api-hpa
spec:
  scaleTargetRef:
    apiVersion: apps/v1
    kind: Deployment
    name: api
  minReplicas: 3               # Cover baseline traffic, not 1
  maxReplicas: 20
  metrics:
    - type: Resource
      resource:
        name: cpu
        target:
          type: Utilization
          averageUtilization: 70
  behavior:
    scaleDown:
      stabilizationWindowSeconds: 300   # Wait 5 min before scaling down to avoid flapping
Resource requests and limits set. Without requests, the scheduler can't make smart placement decisions and your pod gets BestEffort QoS - first to be evicted under memory pressure. Without limits, a runaway process can starve everything else on the node. The check fails when a container is missing CPU requests, memory requests, or memory limits. (CPU limits are a more nuanced call - we'll cover the tradeoff in the next section.) Fix: set explicit resources.requests and resources.limits for every container. For sizing, measure first, don't guess.
containers:
  - name: api
    resources:
      requests:                # Used for scheduling decisions
        cpu: "200m"
        memory: "256Mi"
      limits:
        memory: "512Mi"       # ~2x request for spike headroom; CPU left unlimited on purpose
Category 5: Resource hygiene
Resource hygiene checks are the finer-grained version of Performance: the difference between "set resources" and "set them correctly."
CPU requests defined. Missing CPU requests means the scheduler treats your pod as needing nothing, which leads to noisy-neighbor problems and unfair scheduling. Fix: set a resources.requests.cpu that reflects your service's actual baseline. 100m is a starting point for a small service; measure to refine.
Memory requests defined. Same logic for memory: without requests, Kubernetes can't reserve capacity for your pod and the node can over-commit. Memory pressure then triggers OOM kills in arbitrary order, often killing your pod instead of the actual offender. Fix: set resources.requests.memory based on your service's working set, not its idle footprint.
QoS class is Guaranteed or Burstable. The QoS class is derived from how you set requests and limits. Guaranteed (requests == limits, set for both CPU and memory) is the safest under pressure. Burstable (requests set, limits set higher) is the most common compromise. BestEffort (neither set) is what you want to fail every time. Fix: at minimum, set requests and limits such that Kubernetes gives your pod Burstable QoS. For tier-1 services, consider Guaranteed so they're last to be evicted.
Per-container hygiene is easy to forget on the next manifest someone writes. Two namespace-level objects make the defaults stick: LimitRange fills in requests and limits a container omitted, and ResourceQuota caps what the whole namespace can consume so one team's runaway pods can't starve everyone else.
apiVersion: v1
kind: LimitRange
metadata:
  name: default-limits
  namespace: production
spec:
  limits:
    - type: Container
      defaultRequest:           # Applied when a container omits requests
        cpu: "100m"
        memory: "128Mi"
      default:                  # Applied when a container omits limits
        memory: "256Mi"         # Memory only - deliberately no CPU limit (see QoS note above)
---
apiVersion: v1
kind: ResourceQuota
metadata:
  name: production-quota
  namespace: production
spec:
  hard:                         # Ceiling for the entire namespace
    requests.cpu: "20"
    requests.memory: "40Gi"
    limits.memory: "80Gi"
    pods: "100"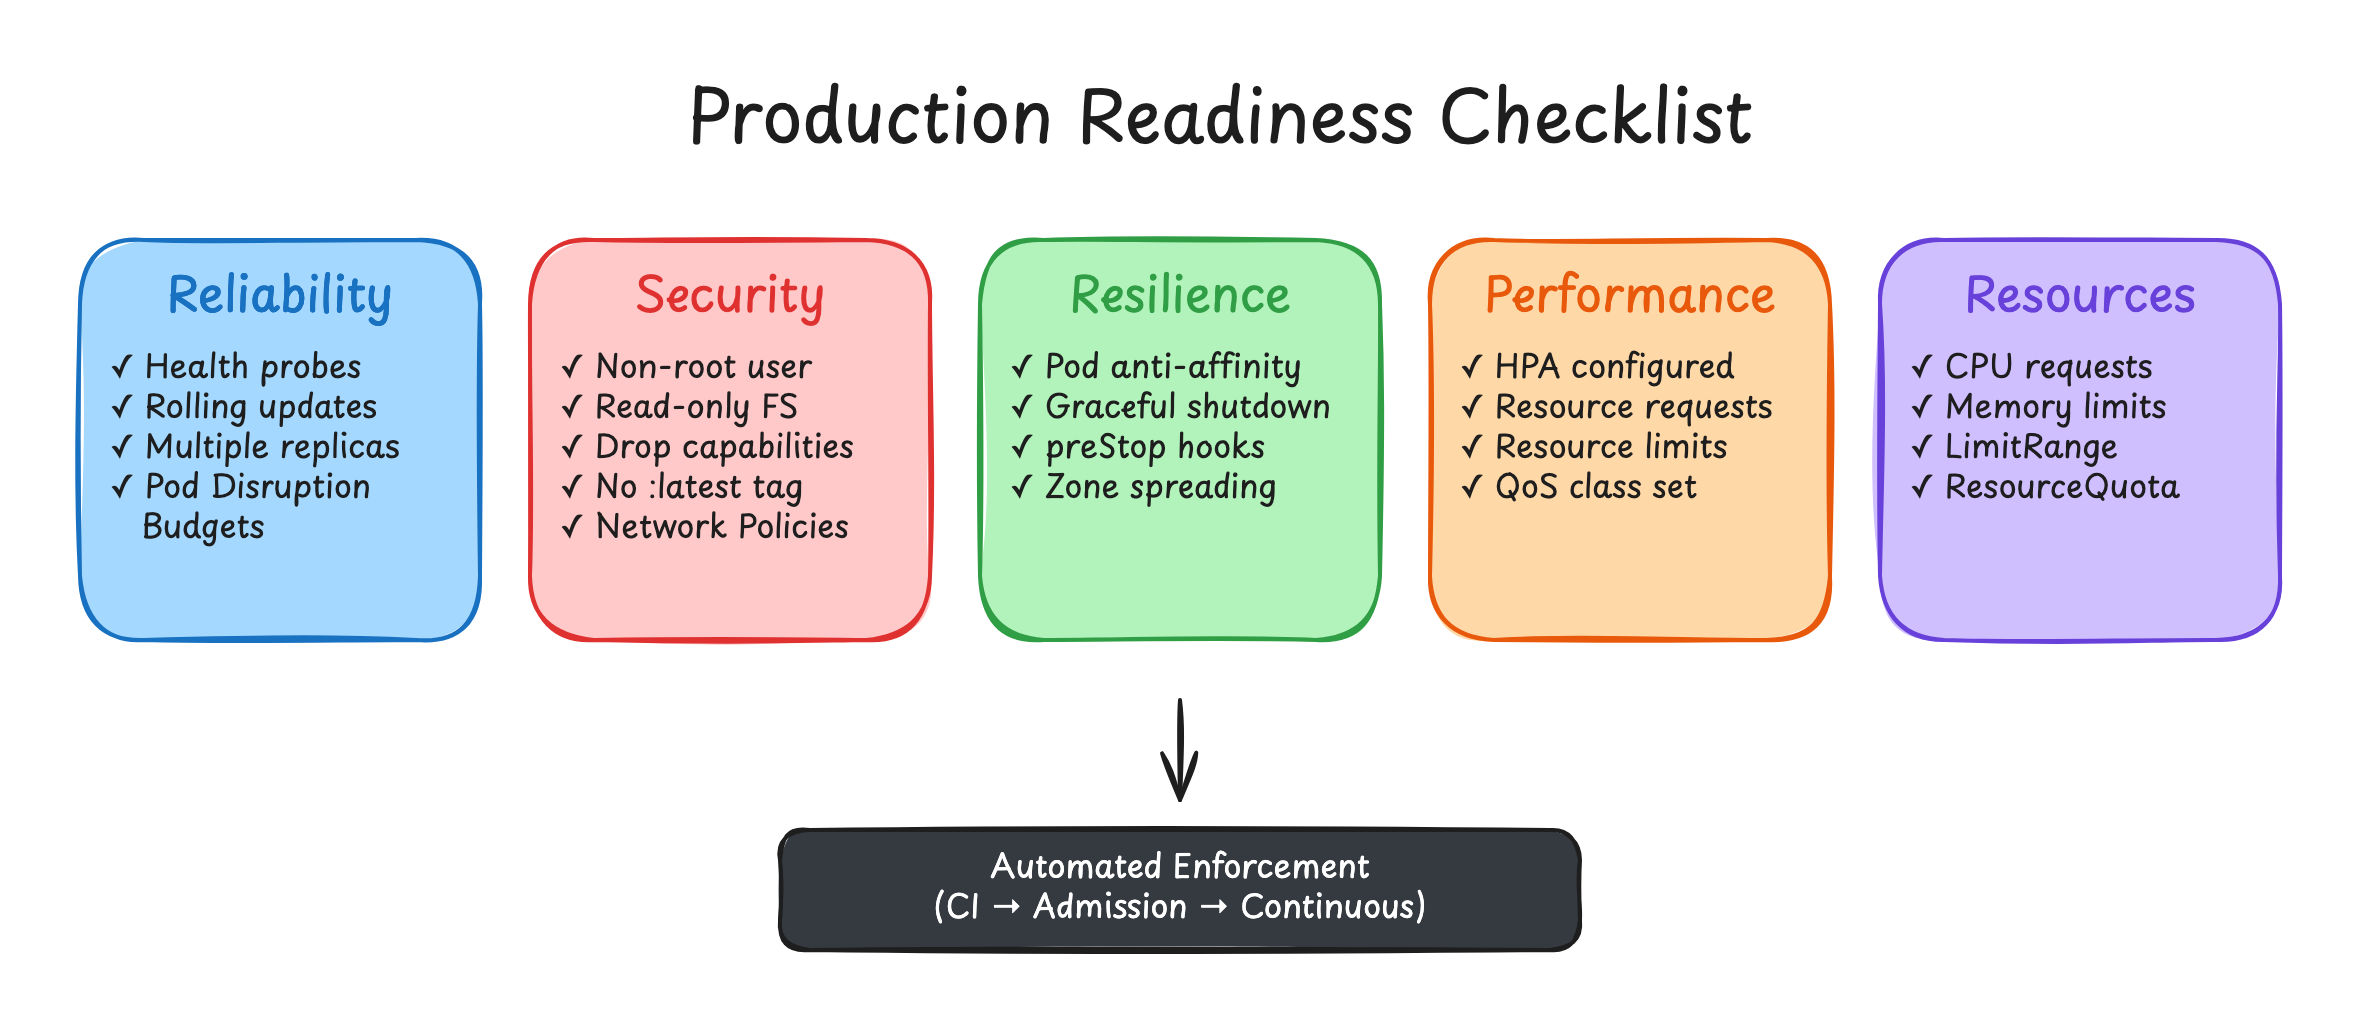
What a manifest checklist can't see
The checks above are everything you can assert against a Deployment's YAML. Production readiness has a second half that doesn't live in a manifest, and it's the half that gets skipped under deadline pressure:
Observability
- Structured JSON logs to stdout/stderr, not files inside the container
- A Prometheus metrics endpoint exposed (
/metrics) - Alerts on error rate, latency, and saturation
- Distributed tracing (OpenTelemetry)
Operational readiness
- SLOs defined for availability and latency
- Runbooks for the common failure modes
- Load testing done before go-live
- A dependency map - what you call, and what calls you
- Backup and restore procedures for anything stateful
Secrets management
- Secrets stored externally (External Secrets Operator, Sealed Secrets, Vault), not baked into manifests - see how to manage secrets in Kubernetes
- ServiceAccount token automount disabled unless the workload actually calls the API
None of these reduce to a single field, so a YAML scanner won't catch them - but they're where the long tail of incidents lives. Teams routinely lose weeks a year to Kubernetes troubleshooting, and a lot of that is time good observability would have turned into a five-minute fix.
Configurable to your standards, not ours
The list above is what we believe production readiness means for a typical Kubernetes service in 2026. It's not the only valid opinion. Different organizations have different risk profiles, different compliance requirements, and different patterns they've already invested in.
The framework lets you make those calls explicitly:
- Toggle individual checks on or off. If your org genuinely needs privileged containers for a class of services, disable that check globally - or for a specific namespace.
- Override importance levels per check. The default is critical / high / medium; you can change the severity to match your own tier definitions.
- Add custom checks for org-specific requirements. Internal SLOs, naming conventions, label requirements, a DB-migration timeout that's specific to your stack - any predicate you can express against a Kubernetes resource can become a check.
- Exclude environments from enforcement. Dev and preview environments usually don't need the same standards as prod; the framework lets you scope checks by environment.
- Acknowledge a failing check with a documented reason. The check still shows as failed in the catalog, but it doesn't block a deploy. The reason is recorded against the check - so technical debt stays visible rather than invisible.
The point of configurability isn't to let teams turn the whole thing off. It's to let teams own their version of the standard, so the standard is something they agreed to rather than something a vendor imposed.
Two modes: surface, or block
Production-readiness checks are useful at two distinct moments: when you're looking at what's already running ("is this service production-ready?") and when you're deploying something new ("should this deploy be allowed?").
Surface mode runs the checks continuously against every deployment and shows the results in the service catalog. Engineers see what's failing, fix or acknowledge, and the standard improves over time without anyone being blocked. This is where most teams should start. It's low-friction, high-visibility, and it surfaces existing technical debt without creating a deployment hostage situation.
Enforce mode pairs the checks with Kyverno admission policies. Non-compliant deployments are rejected at admission control - they never reach the cluster. This is the right gear for organizations with hard compliance requirements, or for specific check classes (TLS on ingress, non-root user) where there's genuinely no acceptable exception in production.
You can mix the two. A common pattern: enforce a small set of critical security checks (no privileged containers, TLS on prod ingresses), surface everything else. That way the deploy-blocking happens only for things that would be unambiguously bad, and the everyday "you should really set resource requests" stays a conversation rather than a wall.
The framework supports running Kyverno in audit mode first - surfacing violations without blocking - so you can verify a policy won't cause a deploy storm before flipping to enforce. Use it. Going straight to enforce on a freshly added policy is how you discover at 9am on Monday that 30 of your existing services were already non-compliant.
What the workflow looks like end to end
- Enable the framework for a service, or for an entire environment. Skyhook starts scanning immediately - no agents to install, no sidecar to deploy.
- Checks run automatically on every deployment. Results appear in the service catalog with pass / warn / fail status per check, color-coded by importance.
- For every failure, you get an actionable fix suggestion - the specific YAML change to make, or a link to the standard playbook. You either apply the fix or acknowledge with a reason that goes into the audit log.
- When you're ready, enable Kyverno enforcement for the specific checks where "fail" should mean "no deploy." Start in audit mode, verify, then switch to enforce.
That's it. The checklist runs forever, the standard is visible, technical debt is documented rather than invisible, and the things that should be unconditional - no privileged containers in prod, no plain-HTTP ingresses, no :latest tags - become unconditional.
Why this beats the wiki page
Most teams already have a production-readiness checklist somewhere. It usually lives in a Notion page, gets reviewed during onboarding, and slowly diverges from reality. A new service launches and three checks get skipped because the engineer who knew about them was on vacation. Two years later, that service is the one that takes prod down.
Automating the checklist isn't a process improvement; it's the difference between a standard that exists and one that doesn't. The first month feels great either way. The third year is where the gap shows.
If you're building this yourself, the 20-odd checks above are the ones we'd hand you. If you'd rather inherit the framework, that's what Skyhook's Production Readiness Framework is. Either way - the boring stuff is what saves you. Make sure it's getting checked.