Zero-Latency Kubernetes: How We Built a Push-Based Sync Architecture
By Eyal Dulberg, CTO
When you're building a platform that shows Kubernetes cluster state, freshness and latency matter. Users expect the dashboard to reflect reality, and they expect to be able to click around quickly. A pod that crashed 25 seconds ago should show as crashed now, not on the next cache refresh.
Our original architecture couldn't deliver on either front. Data was up to 25 seconds stale, and even when the cache was warm, it was often enough invalid for at least one resource type - meaning the dashboard had to fetch it from the cluster on demand, adding seconds of latency to what should feel instant.
This post covers the push-based sync protocol we built to solve this. It's the companion to our SharedInformer caching post, which covers the agent-side in-memory cache that feeds this system. You can read them in either order, but together they explain the full pipeline from Kubernetes API server to dashboard.
The Problem: Pull-Based Polling
Our first architecture was straightforward:
Frontend → Backend (cache check, 25s TTL) → Task Queue → Agent polls (1s) → Agent fetches k8s → Returns
When a user opened a cluster view, the backend checked its cache. Cache miss? Queue a task. The agent polled every second, picked it up, fetched data from Kubernetes, and returned it. Not slow per se - but the multi-hop round-trip plus cache TTL meant data could be up to 25 seconds stale.
And that's the optimistic case. On larger clusters, individual Kubernetes API calls can take a few seconds rather than milliseconds. When a user navigates through Skyhook - clicking into a cluster, viewing different resource types - each interaction can trigger multiple fetch tasks. Even with the agent's built-in parallelism, a burst of concurrent requests could push end-to-end response times into several seconds territory. Combine that with cache staleness and the experience felt sluggish.
The issues:
- Staleness: Cache TTL meant users saw data up to 25 seconds old even though the agent polled frequently
- Slow under load: On large clusters, Kubernetes API calls are slower, and bursts of user activity could saturate the agent's fetch capacity
- Reactive, not proactive: The agent only fetched data when asked - it had no awareness of changes happening in the cluster
- Redundant work: Agents polling every second even when nothing changed, backend re-fetching resources that hadn't been modified
The Solution: Push-Based Sync
The fix seems obvious: have the agent push changes as they happen. But the implementation has subtleties worth walking through.
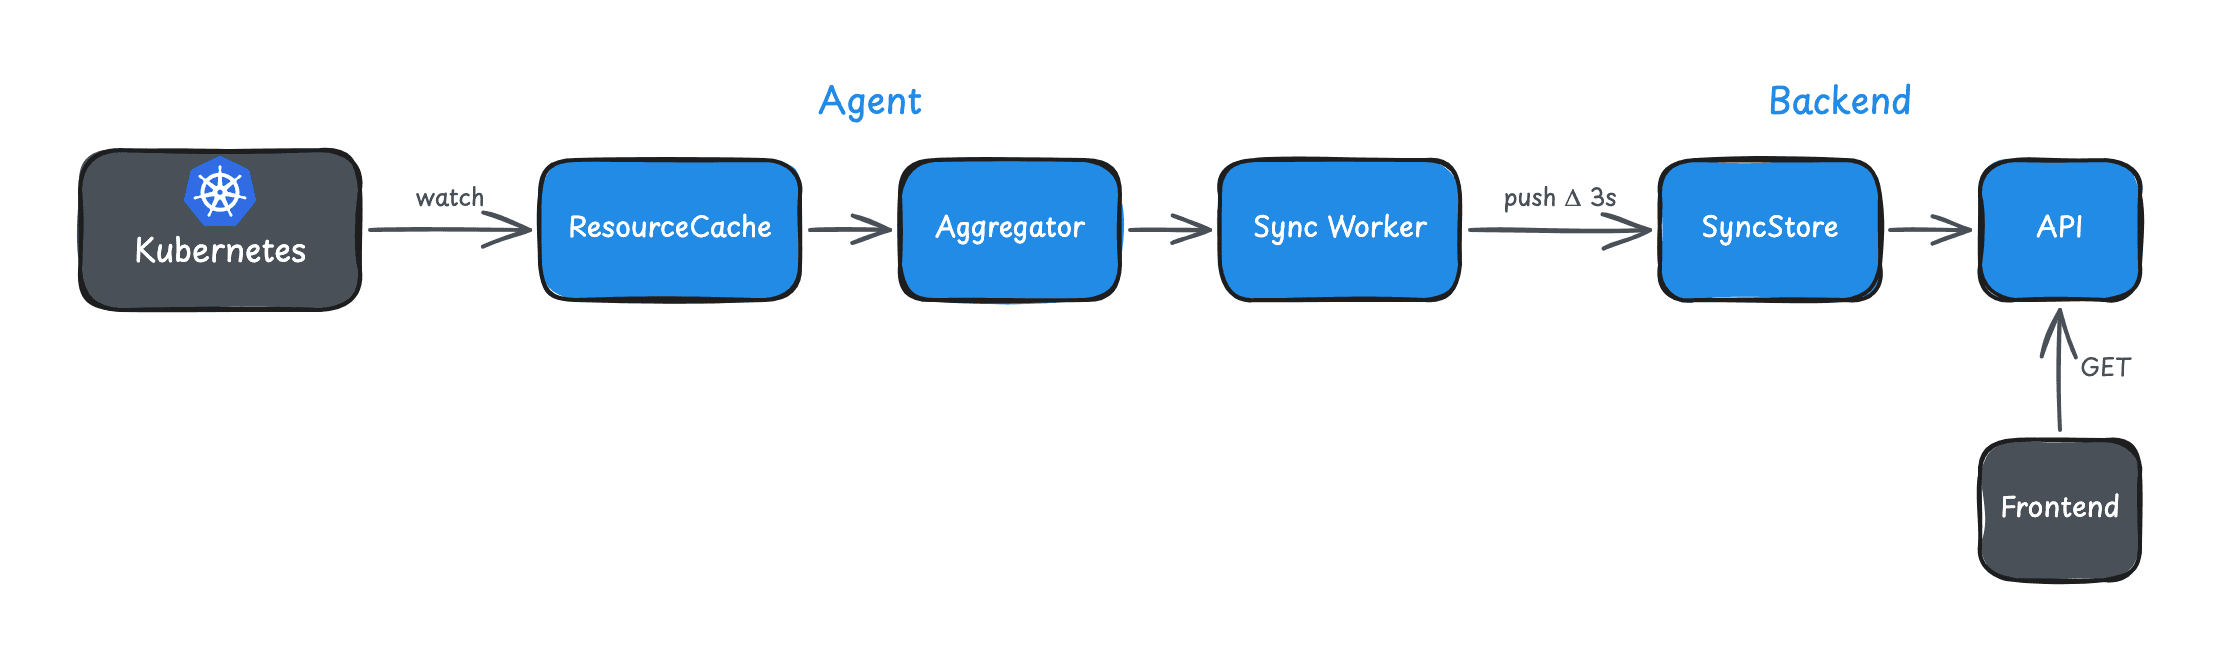
High-Level Flow
┌─────────────────────────────────────────────────┐
│ Kubernetes API Server                            │
└────────┬────────────────────────────────────────┘
         │ Watch (SharedInformers)
         ▼
┌─────────────────────────────────────────────────┐
│ Agent (skyhook-connector)                        │
│  ResourceCache → Aggregator → Sync Worker       │
└────────┬────────────────────────────────────────┘
         │ POST /sync (deltas every 3s)
         ▼
┌─────────────────────────────────────────────────┐
│ Backend (cluster-agent-controller)               │
│  SyncStore → API Endpoints                       │
└─────────────────────────────────────────────────┘
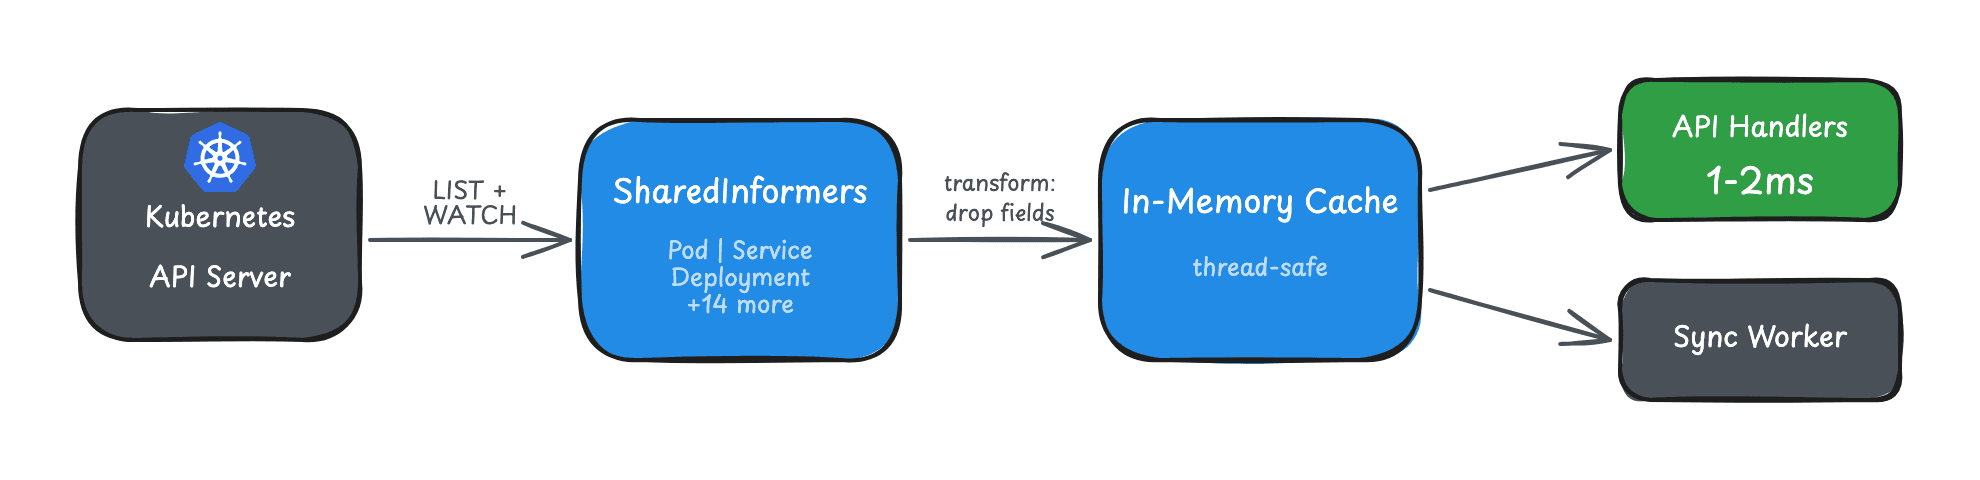
The agent watches Kubernetes resources using SharedInformers, aggregates changes, and pushes deltas to the backend every 3 seconds. The backend stores this state and serves it directly - no round-trip to the cluster needed.
Result: sub-3-second staleness instead of 25.
What We Got Right (and What We Had to Iterate On)
We anticipated a lot of the challenges upfront. Activity-based activation, delta sync, batching/aggregation, overflow protection, staleness fallback - these were all in the initial design. We knew that syncing all clusters all the time would be wasteful, so sync was demand-driven from day one.
But some things only become obvious when you hit real clusters at scale.
Activity-Based Activation (Day One)
Sync is OFF by default. It activates when someone accesses the cluster.
func (s *SyncStore) RecordActivity(clusterID string) {
    state.LastActivityTime = time.Now()

    if !state.SyncEnabled && state.Mode != "manual_off" {
        state.SyncEnabled = true
        // Tell the agent to start syncing
        go s.onSyncControlChange(clusterID, true)
    }
}
Every API endpoint that touches cluster data calls RecordActivity(). First access triggers sync. The agent receives a sync_control task, enables its sync worker, and immediately pushes a full snapshot.
Idle Detection
What about clusters that were active but aren't anymore? We run an idle checker every minute:
const idleTimeout = 30 * time.Minute

func (c *IdleChecker) checkIdleClusters() {
    for _, cluster := range c.store.GetAllClusters() {
        if time.Since(cluster.LastActivityTime) > idleTimeout {
            c.store.DisableSync(cluster.ID)
        }
    }
}
30 minutes of no activity? Sync disabled. The agent stops pushing. Zero overhead until someone looks again.
Delta Sync vs Full Sync
Pushing the entire cluster state every 3 seconds would be wasteful. Instead, we use delta sync for normal operation and full sync for recovery.
Delta Sync (Normal Operation)
The agent tracks changes since the last push:
{
  "SyncType": "delta",
  "SequenceNumber": 42,
  "Deltas": [
    {
      "Kind": "Pod",
      "Namespace": "default",
      "Name": "api-7d4b8c9-xk2pm",
      "Operation": "update",
      "Object": { "status": { "phase": "Running" } }
    }
  ]
}
Each delta batch has a sequence number. The backend validates that SequenceNumber == LastSequence + 1. If there's a gap, something was lost in transit.
Full Sync (Recovery)
Full sync sends everything:
{
  "SyncType": "full",
  "SequenceNumber": 1,
  "Snapshots": {
    "Pod": [{ }, { }, { }],
    "Service": [{ }],
    "Deployment": [{ }]
  }
}
Full sync triggers on:
- Sync enabled (OFF → ON transition)
- Sequence gap detected
- Explicit request from backend
- Manual resync via dashboard
After full sync, sequence resets to 1 and delta sync resumes.
Aggregation and Coalescing
Kubernetes clusters are chatty. A deployment rollout can generate hundreds of events per second. Pushing every event individually would overwhelm the network.
The aggregator batches and deduplicates:
func (a *Aggregator) coalesce(existing, new *ResourceDelta) *ResourceDelta {
    // add + delete = nil (resource appeared and disappeared)
    if existing.Operation == "add" && new.Operation == "delete" {
        return nil
    }
    // delete + add = update (resource was replaced)
    if existing.Operation == "delete" && new.Operation == "add" {
        return &ResourceDelta{Operation: "update", Object: new.Object}
    }
    // Otherwise: latest state wins
    return new
}
If a pod is created and deleted within the same 3-second window, we send nothing. If it's updated 50 times, we send one update with the final state.
Overflow Protection
What if changes come faster than we can process? We cap the pending queue:
const (
    maxEventDeltasPerBatch = 500
    maxPendingEvents       = 2000
)
If pending events exceed 2000, oldest events are dropped. This prevents memory exhaustion from pathological cases (CrashLoopBackOff generating infinite events). A full resync will eventually restore consistency.
Staleness and Fallback
Push-based sync is great when it's working. But what if the agent disconnects? We can't serve stale data forever.
We track staleness in three states:
| State | Condition | Behavior |
|---|---|---|
| Fresh | Last sync < 60s | Serve from SyncStore |
| Stale | 60s - 5min | Fall back to task-based fetch |
| Disconnected | > 5min | Fall back to task-based fetch |
The API lookup order:
func (s *Service) GetPods(clusterID string) ([]Pod, error) {
    if !s.syncStore.IsStale(clusterID) {
        // Fresh data available - sub-millisecond response
        return s.syncStore.GetPods(clusterID)
    }
    // Stale or disconnected - fall back to pull-based
    return s.fetchViaTasks(clusterID)
}
This maintains backward compatibility. If push sync fails, the system degrades gracefully to the old pull-based flow.
Resource Type Filtering
Not every use case needs all 17 resource types. The backend can specify which types to sync:
{
  "type": "sync_control",
  "args": {
    "enabled": "true",
    "resourceTypes": "Pod,Service,Deployment"
  }
}
This reduces bandwidth for focused use cases and saves memory in the agent.
Where We Had to Iterate
The core sync protocol worked well from the start. The surprises came from payload size and memory.
Payload Size: Compression and Stripping
Our first sync payloads were huge. A large cluster's pod list could exceed 2MB, and we were hitting 413 Request Entity Too Large errors on the backend.
The first fix was gzip compression on all sync payloads - an 85-90% size reduction. A 2MB pod payload compressed to ~240KB.
But compression doesn't help memory on the agent side. Kubernetes objects carry a lot of data you don't need for a dashboard - managedFields, last-applied-configuration, CRD validation schemas. We added transform functions to strip these before they enter the cache, reducing object sizes by 30-50%. These weren't all in the initial release. We added them incrementally as we tested against larger clusters and profiled what was eating memory.
Memory: The Go Marshalling Problem
On small clusters, everything was fine. On large clusters (1000+ pods, dozens of CRDs), memory usage spiked well beyond what the raw data size would suggest.
The culprit: Go's JSON marshalling. Every sync cycle, we serialize the delta batch to JSON for the HTTP payload. json.Marshal allocates intermediate buffers - it builds the output incrementally, concatenating fragments, each step allocating. For large objects, this creates significant GC pressure. The garbage collector can't reclaim memory fast enough, and RSS climbs.
We had to profile this carefully. pprof heap profiles showed allocations dominated by JSON serialization, not by the cache itself. The fixes were incremental:
GOMEMLIMIT: We auto-set Go's memory limit to 75% of the container's allocation (768MB of the default 1GB). This makes the GC work harder to stay within bounds, significantly reducing RSS without affecting throughput.- Per-resource-type cache breakdown: We built observability tooling to measure JSON-serialized size per resource type, identify which types were dominating memory, and surface the largest individual objects (like oversized ConfigMaps).
- Selective caching: Not every resource type needs to be cached. We refined which resources to sync by default and gave the backend control over which types to request.
This is an area we're still optimizing. Go's standard encoding/json is known for allocation-heavy marshalling, and the ecosystem is moving toward streaming alternatives. For now, the combination of field stripping, memory limits, and selective caching keeps things manageable.
Resync Storm Protection
The overflow protection and resync logic worked, but needed tuning in practice. During testing we hit a failure mode: resync loops.
- Agent sends delta with sequence 43
- Backend expected 42 (missed one)
- Backend requests full resync
- Agent sends full sync
- Something corrupts - backend requests resync again
- Infinite loop
The fix was rate limiting:
const (
    maxResyncPerMinute    = 5
    resyncBackoffDuration = 30 * time.Second
)
Five resyncs within a minute triggers a 30-second backoff. This gives transient issues time to resolve and prevents runaway resource consumption.
What We Learned
1. Anticipate the Obvious, Profile the Rest
Activity-based activation, delta sync, and graceful fallback were clear requirements from the start. But memory behavior on large clusters only became visible through profiling real workloads. Design for what you know, then measure.
2. Sequence Numbers Are Essential
Without sequence validation, we'd silently lose events and serve inconsistent data. The gap detection and resync flow ensures eventual consistency even under network partitions.
3. Graceful Degradation Matters
Push sync is an optimization, not a requirement. When it fails, we fall back to pull. Users see slower responses but never errors. This let us ship incrementally rather than doing a risky big-bang migration.
Results
After deploying push-based sync:
- Freshness: Up to 25s stale → sub-3 seconds (when sync active)
- Dashboard latency: ~80% reduction. Before, even one cache-miss resource type meant a round-trip to the cluster, adding seconds. Now every resource is served from the SyncStore in milliseconds.
- API server load: Reduced (fewer direct fetches)
- Network efficiency: Only active clusters sync
The architecture is more complex than simple polling. But for a platform where users click through clusters, namespaces, and resource types expecting instant responses, the difference is night and day.
This is part of our series on building real-time Kubernetes control planes. See also: 50-100x Faster: Building an In-Memory Kubernetes Resource Cache with SharedInformers.
Want to see this in action? Try Skyhook free and connect a cluster - you'll see the push sync kick in immediately. This architecture also powers Radar Cloud's real-time multi-cluster view.