50-100x Faster: Building an In-Memory Kubernetes Resource Cache with SharedInformers
By Eyal Dulberg, CTO
Every call to the Kubernetes API server costs network round-trip time plus server-side processing. For a small cluster, a LIST call might take 50-100ms. For a larger cluster with hundreds of pods, it can easily take several hundred milliseconds to seconds - the Kubernetes SLO for LIST calls allows up to 30 seconds at p99. For a dashboard that displays pods, services, deployments, and nodes, even the best case adds up fast.
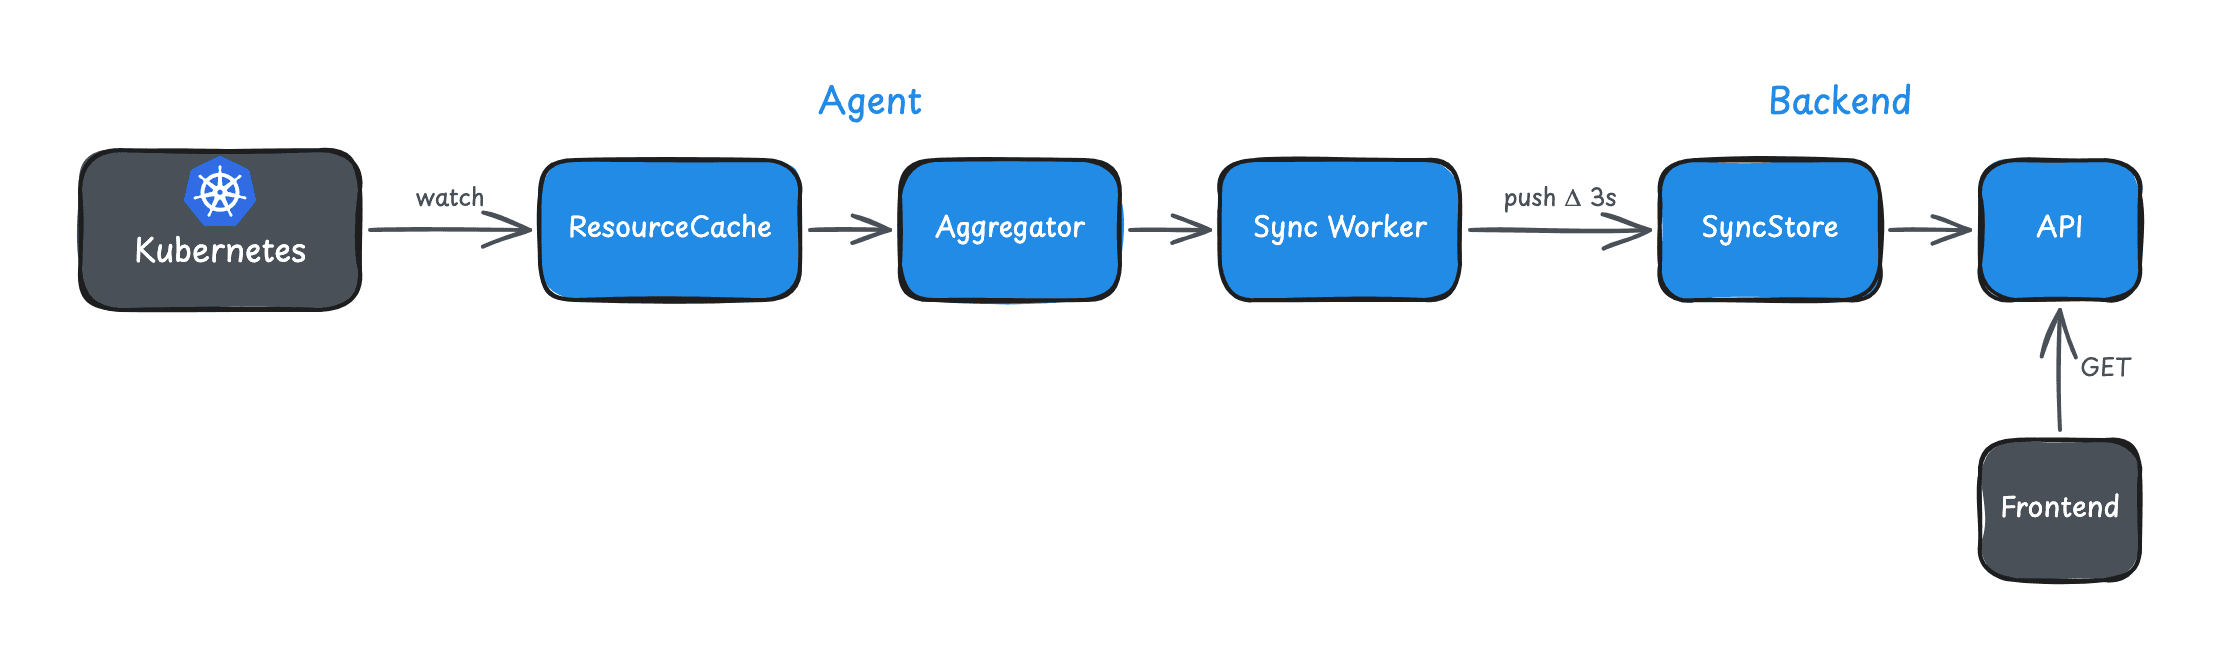
We wanted sub-50ms responses even for larger clusters or busy agents. This post explains how we got there using SharedInformers - the agent-side caching layer. The companion post on push-based sync covers how this cached data gets from the agent to the backend.
The Pattern: Watch, Don't Poll
The naive approach to Kubernetes data is polling:
// Don't do this
for {
    pods, _ := client.CoreV1().Pods("").List(ctx, metav1.ListOptions{})
    cache.Store(pods)
    time.Sleep(10 * time.Second)
}
Problems:
- 50ms-seconds latency per request depending on cluster size
- Stale data between polls
- Load on API server scales with poll frequency
- No notification when data actually changes
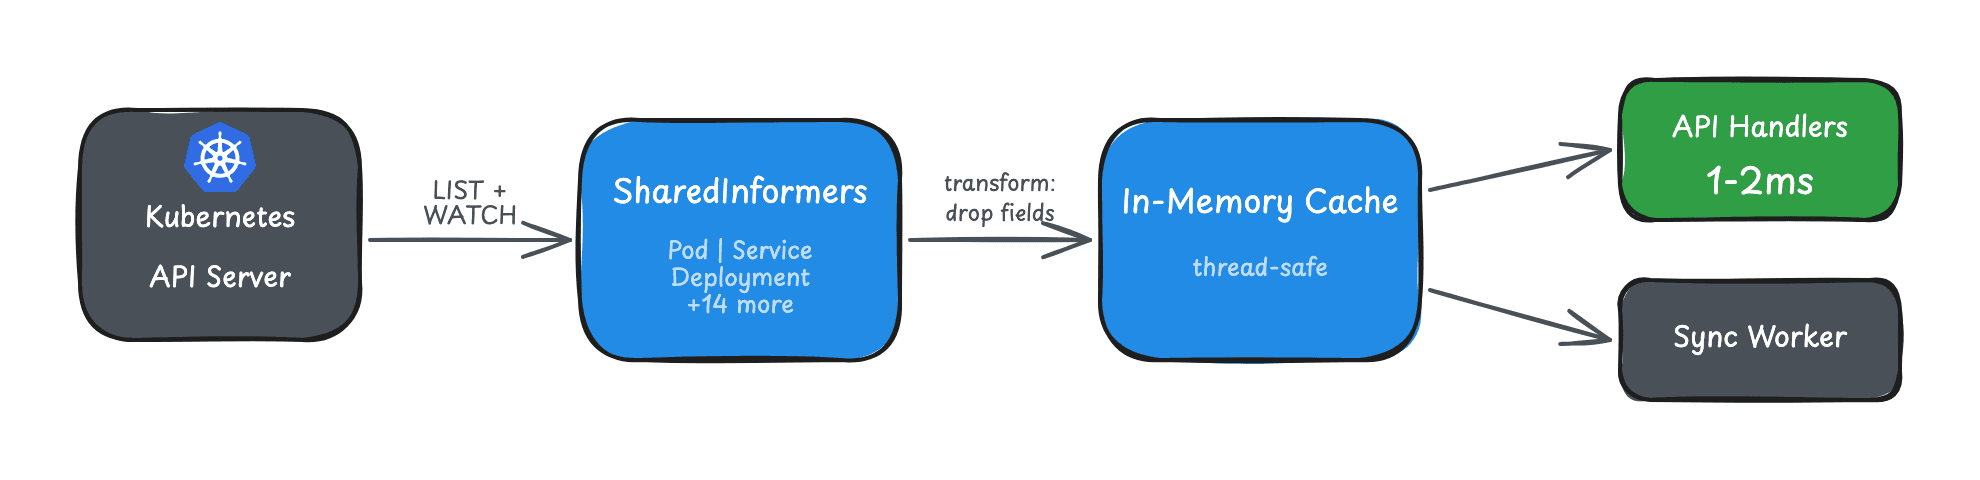
The Kubernetes ecosystem solved this years ago with the Informer pattern. Informers use the Watch API: one initial LIST to populate the cache, then a persistent connection that receives events as they happen.
// SharedInformer pattern
informer := cache.NewSharedInformer(
    &cache.ListWatch{
        ListFunc:  func(options metav1.ListOptions) (runtime.Object, error) { ... },
        WatchFunc: func(options metav1.ListOptions) (watch.Interface, error) { ... },
    },
    &v1.Pod{},
    0, // No resync period
)
The "Shared" prefix means multiple consumers can use the same informer. Without sharing, each consumer would create its own watch connection - wasteful.
Our Implementation
We cache 17 resource types across the entire cluster:
| Category | Resources |
|---|---|
| Core | Pod, Service, Node, Namespace, PVC, ConfigMap, ServiceAccount |
| Apps | Deployment, DaemonSet, StatefulSet, ReplicaSet |
| Networking | Ingress, IngressClass |
| Batch | Job, CronJob |
| Storage | StorageClass |
| Events | Event |
Initialization
func InitResourceCache() error {
    config, err := rest.InClusterConfig()
    if err != nil {
        return err
    }

    clientset, err := kubernetes.NewForConfig(config)
    if err != nil {
        return err
    }

    // SharedInformerFactory creates informers that share the same connection
    factory := informers.NewSharedInformerFactory(clientset, 0)

    rc := &ResourceCache{
        factory:   factory,
        clientset: clientset,
        changes:   make(chan ResourceChange, 1000),
    }

    // Register all informers
    rc.pods = factory.Core().V1().Pods()
    rc.services = factory.Core().V1().Services()
    rc.deployments = factory.Apps().V1().Deployments()
    // ... 14 more

    // Add event handlers for change notifications
    rc.pods.Informer().AddEventHandler(rc.makeHandler("Pod"))
    rc.services.Informer().AddEventHandler(rc.makeHandler("Service"))
    // ...

    // Start all informers
    factory.Start(rc.stopCh)

    // Wait for initial cache population
    if !cache.WaitForCacheSync(rc.stopCh, rc.pods.Informer().HasSynced, ...) {
        return errors.New("failed to sync caches")
    }

    return nil
}
Key points:
- No resync period: We set it to 0. The watch provides continuous updates; periodic full re-lists just add load.
- SharedInformerFactory: All informers share resources (goroutines, connections).
- WaitForCacheSync: Block until initial LIST completes. Don't serve stale data on startup.
Usage
Once initialized, lookups are trivial:
// List all pods in a namespace - 1-2ms
pods, err := cache.Pods().Pods("default").List(labels.Everything())

// Get specific service - under 1ms
svc, err := cache.Services().Services("default").Get("my-service")

// List with label selector - 1-2ms
selector := labels.SelectorFromSet(map[string]string{"app": "api"})
pods, err := cache.Pods().Pods("").List(selector)
Compare to direct API calls:
// Direct API - 50ms to seconds depending on cluster size
pods, err := clientset.CoreV1().Pods("default").List(ctx, metav1.ListOptions{})
Orders of magnitude faster. For dashboards displaying multiple resource types, this turns multi-second loads into sub-10ms.
Memory Optimization: Stripping Metadata
Raw Kubernetes objects carry baggage. A typical Pod object includes:
metadata.managedFields: Tracks which controller owns which fields. Can be 30% of object size.kubectl.kubernetes.io/last-applied-configuration: The entire manifest that was applied. 10-100KB per object.
For a cache used in UI display, we don't need either. We strip them:
func dropManagedFields(obj interface{}) (interface{}, error) {
    accessor, err := meta.Accessor(obj)
    if err != nil {
        return obj, nil
    }

    // Drop managedFields - ~30% memory savings
    accessor.SetManagedFields(nil)

    // Drop last-applied-configuration annotation
    annotations := accessor.GetAnnotations()
    if annotations != nil {
        delete(annotations, "kubectl.kubernetes.io/last-applied-configuration")
        accessor.SetAnnotations(annotations)
    }

    return obj, nil
}

// Apply to all informers via transform function
factory := informers.NewSharedInformerFactoryWithOptions(
    clientset,
    0,
    informers.WithTransform(dropManagedFields),
)
For a cluster with 500 pods, this reduces memory from ~40MB to ~25MB. Worth it.
Change Notifications
Caching is half the story. We also need to push changes to our sync system. SharedInformers support event handlers:
func (rc *ResourceCache) makeHandler(kind string) cache.ResourceEventHandler {
    return cache.ResourceEventHandlerFuncs{
        AddFunc: func(obj interface{}) {
            rc.emitChange(kind, obj, "add")
        },
        UpdateFunc: func(oldObj, newObj interface{}) {
            rc.emitChange(kind, newObj, "update")
        },
        DeleteFunc: func(obj interface{}) {
            rc.emitChange(kind, obj, "delete")
        },
    }
}

func (rc *ResourceCache) emitChange(kind string, obj interface{}, op string) {
    change := ResourceChange{
        Kind:      kind,
        Operation: op,
        Object:    obj,
    }

    select {
    case rc.changes <- change:
    default:
        // Channel full - drop event, log warning
        log.Warn("Resource change channel full, dropping event",
            zap.String("kind", kind))
    }
}
The channel is buffered (capacity 1000) and non-blocking. If the consumer is slow, we drop events rather than block the informer. Dropped events get recovered via delta sync.
Graceful Fallback
The cache might fail to initialize (permissions, network issues). We don't want that to break the application. Every lookup follows this pattern:
func GetPodsInNamespace(ns string) ([]v1.Pod, error) {
    cache := GetResourceCache()
    if cache != nil {
        pods, err := cache.Pods().Pods(ns).List(labels.Everything())
        if err == nil {
            return pods, nil
        }
        log.Warn("Cache lookup failed, falling back to API", zap.Error(err))
    }

    // Fallback to direct API call
    return clientset.CoreV1().Pods(ns).List(ctx, metav1.ListOptions{})
}
This ensures:
- Optimal performance when cache works (most of the time)
- Reliability when cache fails (rare but possible)
- No downtime or errors during startup or transient issues
What We Don't Cache
Not everything belongs in a SharedInformer cache.
Secrets: We minimize sensitive data in memory. Even if it's convenient, caching secrets creates risk. We fetch them on-demand, and only if users opt-in to secrets read permission in the first place.
Custom Resources: Handled separately with a dynamic informer that discovers CRDs at runtime. Different lifecycle than core resources.
High-Churn Resources: Events are the exception - we cache them but filter aggressively. Without filtering, a busy cluster generates thousands of events per minute.
Memory Characteristics
For a typical small-to-mid cluster (500 pods, 50 services, 30 deployments), the typed informer cache looks like:
Raw cache size:     ~11-14 MB
With Go overhead:   ~23-28 MB
Goroutines:         ~32 (2 per typed informer)
Watch connections:  16 (multiplexed via HTTP/2)
Dynamic informers for CRDs (Argo Rollouts, cert-manager, Flux, etc.) add more - roughly 2 goroutines per discovered CRD type. A cluster with 20 CRDs adds ~40 more goroutines. Not free, but manageable.
Startup cost:
16 typed LIST calls:    ~1-2 seconds (blocks until populated)
CRD discovery:          5-10 seconds (runs in background)
The typed informer cache blocks on startup - you don't serve data until it's populated. CRD discovery runs in the background so the UI is usable immediately for core resources. On clusters with many CRDs (~100+), we had to fix a discovery waterfall that was taking minutes - parallelizing and caching the discovery results brought it down to seconds.
Consistency Model
SharedInformers provide eventual consistency, not strong consistency.
Under normal operation, staleness is sub-second - events arrive almost instantly via watch. But during network partitions or API server restarts, the cache might lag.
For our use case (UI dashboards), this is fine. Users see "eventually correct" data. For cases requiring strong consistency (admission controllers, operators making decisions), you'd want direct API calls with appropriate caching headers.
Thread Safety
All listers are thread-safe for reads. Multiple goroutines can query simultaneously without locking:
// Safe to call from any goroutine
pods1, _ := cache.Pods().Pods("ns1").List(labels.Everything())
pods2, _ := cache.Pods().Pods("ns2").List(labels.Everything())
The underlying store uses read-write locks internally. Writes (from informer events) don't block reads.
Results
After implementing SharedInformer caching (measured on a cluster with ~500 pods):
| Metric | Before | After |
|---|---|---|
| Pod list latency | 80ms | 1.5ms |
| Service lookup | 60ms | 0.8ms |
| Dashboard load (4 resource types) | 400ms+ | <10ms |
| API server load | High | Minimal |
On larger clusters, the "before" numbers are worse - LIST calls can take seconds - making the cache even more impactful. More importantly, it enabled our push-based sync architecture - we can react to changes as they happen rather than polling.
Key Takeaways
-
SharedInformers are the standard pattern for Kubernetes data access in Go. If you're hitting the API directly for every request, you're doing it wrong.
-
Strip what you don't need. managedFields and last-applied-configuration are often 30-50% of object size.
-
Plan for failure. Cache initialization can fail. Always have a fallback path to direct API calls.
-
Eventual consistency is usually fine. For dashboards and monitoring, sub-second staleness is acceptable. For operators making decisions, think harder.
-
Don't cache secrets. Minimize sensitive data in memory. The convenience isn't worth the risk.
This is part of our series on building real-time Kubernetes control planes. See also: Zero-Latency Kubernetes: How We Built a Push-Based Sync Architecture.
Want to see this in action? Try Skyhook free and connect a cluster - the SharedInformer cache powers every resource view. The same cache also powers Radar, our open-source Kubernetes explorer - try it locally in 30 seconds.